Sallie Mae 2009 Annual Report Download - page 210
Download and view the complete annual report
Please find page 210 of the 2009 Sallie Mae annual report below. You can navigate through the pages in the report by either clicking on the pages listed below, or by using the keyword search tool below to find specific information within the annual report.-
 1
1 -
2
-
3
-
4
-
5
-
6
-
7
-
8
-
9
-
10
-
11
-
12
-
13
-
14
-
15
-
16
-
17
-
18
-
19
-
20
-
21
-
22
-
23
-
24
-
25
-
26
-
27
-
28
-
29
-
30
-
31
-
32
-
33
-
34
-
35
-
36
-
37
-
38
-
39
-
40
-
41
-
42
-
43
-
44
-
45
-
46
-
47
-
48
-
49
-
50
-
51
-
52
-
53
-
54
-
55
-
56
-
57
-
58
-
59
-
60
-
61
-
62
-
63
-
64
-
65
-
66
-
67
-
68
-
69
-
70
-
71
-
72
-
73
-
74
-
75
-
76
-
77
-
78
-
79
-
80
-
81
-
82
-
83
-
84
-
85
-
86
-
87
-
88
-
89
-
90
-
91
-
92
-
93
-
94
-
95
-
96
-
97
-
98
-
99
-
100
-
101
-
102
-
103
-
104
-
105
-
106
-
107
-
108
-
109
-
110
-
111
-
112
-
113
-
114
-
115
-
116
-
117
-
118
-
119
-
120
-
121
-
122
-
123
-
124
-
125
-
126
-
127
-
128
-
129
-
130
-
131
-
132
-
133
-
134
-
135
-
136
-
137
-
138
-
139
-
140
-
141
-
142
-
143
-
144
-
145
-
146
-
147
-
148
-
149
-
150
-
151
-
152
-
153
-
154
-
155
-
156
-
157
-
158
-
159
-
160
-
161
-
162
-
163
-
164
-
165
-
166
-
167
-
168
-
169
-
170
-
171
-
172
-
173
-
174
-
175
-
176
-
177
-
178
-
179
-
180
-
181
-
182
-
183
-
184
-
185
-
186
-
187
-
188
-
189
-
190
-
191
-
192
-
193
-
194
-
195
-
196
-
197
-
198
-
199
-
 200
200 -
 201
201 -
 202
202 -
 203
203 -
 204
204 -
 205
205 -
 206
206 -
 207
207 -
 208
208 -
 209
209 -
 210
210 -
 211
211 -
 212
212 -
 213
213 -
 214
214 -
 215
215 -
 216
216 -
 217
217 -
 218
218 -
 219
219 -
 220
220 -
221
-
222
-
223
-
224
-
225
-
226
-
227
-
228
-
229
-
230
-
231
-
232
-
233
-
234
-
235
-
236
-
237
-
238
-
239
-
240
-
241
-
242
-
243
-
244
-
245
-
246
-
247
-
248
-
249
-
250
-
251
-
252
-
253
-
254
-
255
-
256
 |
 |

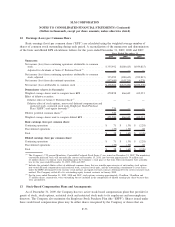
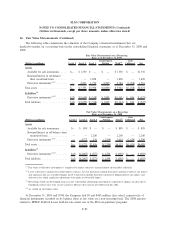
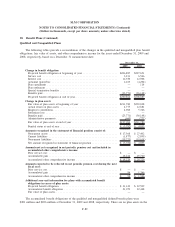
16. Fair Value Measurements (Continued)
The following tables summarize the valuation of the Company’s financial instruments that are
marked-to-market on a recurring basis in the consolidated financial statements as of December 31, 2009 and
2008.
(Dollars in millions) Level 1 Level 2 Level 3
Counterparty
Netting Total
(4)
Cash
Collateral Net
Fair Value Measurements on a Recurring
Basis as of December 31, 2009
Assets
Available for sale investments . . . . . $— $ 1,330 $ — $ — $ 1,330 $ — $1,330
Retained Interest in off-balance
sheet securitized loans . . . . . . . . — — 1,828 — 1,828 — 1,828
Derivative instruments
(1)(2)
. . . . . . . — 2,023 1,770 (1,009) 2,784 (1,268) 1,516
Total assets . . . . . . . . . . . . . . . . . . . $— $ 3,353 $3,598 $(1,009) $ 5,942 $(1,268) $4,674
Liabilities
(3)
Derivative instruments
(1)(2)
. . . . . . . $ (2) $(1,650) $ (518) $ 1,009 $(1,161) $ 636 $ (525)
Total liabilities . . . . . . . . . . . . . . . . . $ (2) $(1,650) $ (518) $ 1,009 $(1,161) $ 636 $ (525)
(Dollars in millions) Level 1 Level 2 Level 3
Counterparty
Netting Total
(4)
Cash
Collateral Net
Fair Value Measurements on a Recurring
Basis as of December 31, 2008
Assets
Available for sale investments . . . . . $— $ 899 $ — $ — $ 899 $ — $ 899
Retained Interest in off-balance sheet
securitized loans . . . . . . . . . . . . . — — 2,200 — 2,200 — 2,200
Derivative instruments
(1)(2)
. . . . . . . . — 4,372 236 (1,594) 3,014 (1,624) 1,390
Total assets . . . . . . . . . . . . . . . . . . . . $— $ 5,271 $2,436 $(1,594) $6,113 $(1,624) $4,489
Liabilities
(3)
Derivative instruments
(1)(2)
. . . . . . . . $ (3) $(2,007) $ (577) $ 1,594 $ (993) $ — $ (993)
Total liabilities . . . . . . . . . . . . . . . . . $ (3) $(2,007) $ (577) $ 1,594 $ (993) $ — $ (993)
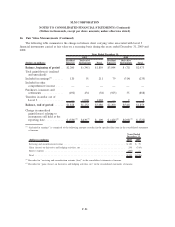
(1)
Fair value of derivative instruments is comprised of market value less accrued interest and excludes collateral.
(2)
Level 1 derivatives include euro-dollar futures contracts. Level 2 derivatives include derivatives indexed to interest rate indices
and currencies that are considered liquid. Level 3 derivatives include derivatives indexed to illiquid interest rate indices and
derivatives for which significant adjustments were made to observable inputs.
(3)
Borrowings which are the hedged items in a fair value hedge relationship and which are adjusted for changes in value due to
benchmark interest rates only are not carried at full fair value and are not reflected in this table.
(4)
As carried on the balance sheet.
At December 31, 2009 and 2008, the Company had $0 and $462 million (fair value), respectively, of
financial instruments recorded on its balance sheet at fair value on a non-recurring basis. The 2008 amount
related to FFELP Stafford Loans held-for-sale under one of the ED loan purchase programs.
F-83
SLM CORPORATION
NOTES TO CONSOLIDATED FINANCIAL STATEMENTS (Continued)
(Dollars in thousands, except per share amounts, unless otherwise stated)