Sallie Mae 2009 Annual Report Download - page 227
Download and view the complete annual report
Please find page 227 of the 2009 Sallie Mae annual report below. You can navigate through the pages in the report by either clicking on the pages listed below, or by using the keyword search tool below to find specific information within the annual report.-
 1
1 -
2
-
3
-
4
-
5
-
6
-
7
-
8
-
9
-
10
-
11
-
12
-
13
-
14
-
15
-
16
-
17
-
18
-
19
-
20
-
21
-
22
-
23
-
24
-
25
-
26
-
27
-
28
-
29
-
30
-
31
-
32
-
33
-
34
-
35
-
36
-
37
-
38
-
39
-
40
-
41
-
42
-
43
-
44
-
45
-
46
-
47
-
48
-
49
-
50
-
51
-
52
-
53
-
54
-
55
-
56
-
57
-
58
-
59
-
60
-
61
-
62
-
63
-
64
-
65
-
66
-
67
-
68
-
69
-
70
-
71
-
72
-
73
-
74
-
75
-
76
-
77
-
78
-
79
-
80
-
81
-
82
-
83
-
84
-
85
-
86
-
87
-
88
-
89
-
90
-
91
-
92
-
93
-
94
-
95
-
96
-
97
-
98
-
99
-
100
-
101
-
102
-
103
-
104
-
105
-
106
-
107
-
108
-
109
-
110
-
111
-
112
-
113
-
114
-
115
-
116
-
117
-
118
-
119
-
120
-
121
-
122
-
123
-
124
-
125
-
126
-
127
-
128
-
129
-
130
-
131
-
132
-
133
-
134
-
135
-
136
-
137
-
138
-
139
-
140
-
141
-
142
-
143
-
144
-
145
-
146
-
147
-
148
-
149
-
150
-
151
-
152
-
153
-
154
-
155
-
156
-
157
-
158
-
159
-
160
-
161
-
162
-
163
-
164
-
165
-
166
-
167
-
168
-
169
-
170
-
171
-
172
-
173
-
174
-
175
-
176
-
177
-
178
-
179
-
180
-
181
-
182
-
183
-
184
-
185
-
186
-
187
-
188
-
189
-
190
-
191
-
192
-
193
-
194
-
195
-
196
-
197
-
198
-
199
-
200
-
201
-
202
-
203
-
204
-
205
-
206
-
207
-
208
-
209
-
210
-
211
-
212
-
213
-
214
-
215
-
216
-
 217
217 -
 218
218 -
 219
219 -
 220
220 -
 221
221 -
 222
222 -
 223
223 -
 224
224 -
 225
225 -
 226
226 -
 227
227 -
 228
228 -
 229
229 -
 230
230 -
 231
231 -
 232
232 -
 233
233 -
 234
234 -
 235
235 -
 236
236 -
 237
237 -
238
-
239
-
240
-
241
-
242
-
243
-
244
-
245
-
246
-
247
-
248
-
249
-
250
-
251
-
252
-
253
-
254
-
255
-
256
 |
 |
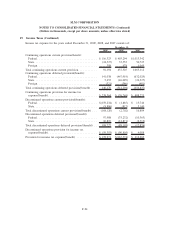
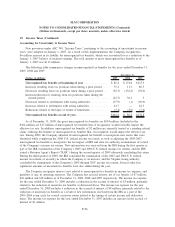
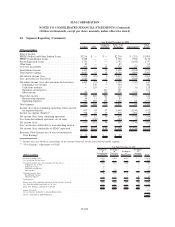
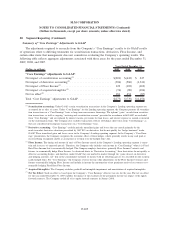
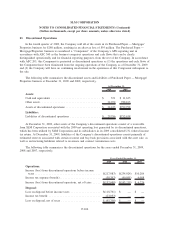
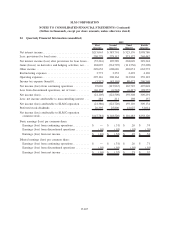
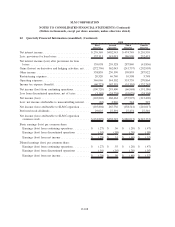
20. Segment Reporting (Continued)
$79 million, $111 million and $17 million of impairments in the years ended December 31, 2009, 2008 and
2007, respectively. The impairment is primarily a result of the impact of the economy on the ability to collect on
these assets. The impairment of $111 million in 2008 includes the $51 million loss on the sale of the Company’s
international Purchased Paper — Non-Mortgage business discussed above. Similar to the Purchased Paper —
Mortgage/Properties business discussion below, when the Purchased Paper — Non-Mortgage business either sells
all of its remaining assets or completely winds down its operations, its results will be shown as discontinued
operations.
Net loss attributable to SLM Corporation from discontinued operations was $157 million and $140 million
for the years ended December 31, 2009 and 2008, respectively, compared to net income of $15 million for the
year ended December 31, 2007. The Company sold all of the assets in its Purchased Paper — Mortgage/
Properties business in the fourth quarter of 2009 for $280 million. Because of the sale, the Purchased Paper —
Mortgage/Properties business is required to be presented separately as discontinued operations for all periods
presented. This sale of assets in the fourth quarter of 2009 resulted in an after-tax loss of $95 million. Total
after-tax impairments, including the loss on sale, for the years ended December 31, 2009, 2008 and 2007 were
$154 million, $161 million and $2 million, respectively.
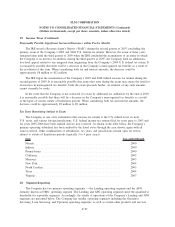
At December 31, 2009 and 2008, the APG business segment had total assets of $1.1 billion and
$2.0 billion, respectively.
Corporate and Other
The Company’s Corporate and Other segment includes the aggregate activity of its smaller operating
segments, primarily its Guarantor Servicing, Loan Servicing and Upromise operating segments. Corporate and
Other also includes several smaller products and services, as well as corporate overhead.
In the Guarantor Servicing operating segment, the Company provides a full complement of administrative
services to FFELP Guarantors including guarantee issuance, account maintenance, and guarantee fulfillment.
In the Loan Servicing operating segment, the Company provides a full complement of activities required to
service student loans on behalf of lenders who are unrelated to the Company. Such servicing activities
generally commence once a loan has been fully disbursed and include sending out payment coupons to
borrowers, processing borrower payments, originating and disbursing FFELP Consolidation Loans on behalf of
the lender, and other administrative activities required by ED.
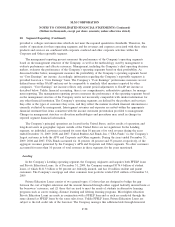
Upromise markets and administers a consumer savings network and also provides program management,
transfer and servicing agent services, and administration services for 529 college-savings plans. The
Company’s other products and services include comprehensive financing and loan delivery solutions that it
provides to college financial aid offices and students to streamline the financial aid process. Corporate
overhead includes all of the typical headquarter functions such as executive management, accounting and
finance, human resources and marketing.
At December 31, 2009 and 2008, the Corporate and Other business segment had total assets of
$1.2 million and $685 million, respectively.
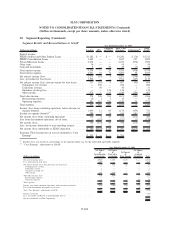
Measure of Profitability
The tables below include the condensed operating results for each of the Company’s reportable segments.
Management, including the chief operating decision makers, evaluates the Company on certain performance
measures that the Company refers to as “Core Earnings” performance measures for each operating segment.
While “Core Earnings” results are not a substitute for reported results under GAAP, the Company relies on
F-100
SLM CORPORATION
NOTES TO CONSOLIDATED FINANCIAL STATEMENTS (Continued)
(Dollars in thousands, except per share amounts, unless otherwise stated)