Sallie Mae 2009 Annual Report Download - page 59
Download and view the complete annual report
Please find page 59 of the 2009 Sallie Mae annual report below. You can navigate through the pages in the report by either clicking on the pages listed below, or by using the keyword search tool below to find specific information within the annual report.-
 1
1 -
2
-
3
-
4
-
5
-
6
-
7
-
8
-
9
-
10
-
11
-
12
-
13
-
14
-
15
-
16
-
17
-
18
-
19
-
20
-
21
-
22
-
23
-
24
-
25
-
26
-
27
-
28
-
29
-
30
-
31
-
32
-
33
-
34
-
35
-
36
-
37
-
38
-
39
-
40
-
41
-
42
-
43
-
44
-
45
-
46
-
47
-
48
-
 49
49 -
 50
50 -
 51
51 -
 52
52 -
 53
53 -
 54
54 -
 55
55 -
 56
56 -
 57
57 -
 58
58 -
 59
59 -
 60
60 -
 61
61 -
 62
62 -
 63
63 -
 64
64 -
 65
65 -
 66
66 -
 67
67 -
 68
68 -
 69
69 -
70
-
71
-
72
-
73
-
74
-
75
-
76
-
77
-
78
-
79
-
80
-
81
-
82
-
83
-
84
-
85
-
86
-
87
-
88
-
89
-
90
-
91
-
92
-
93
-
94
-
95
-
96
-
97
-
98
-
99
-
100
-
101
-
102
-
103
-
104
-
105
-
106
-
107
-
108
-
109
-
110
-
111
-
112
-
113
-
114
-
115
-
116
-
117
-
118
-
119
-
120
-
121
-
122
-
123
-
124
-
125
-
126
-
127
-
128
-
129
-
130
-
131
-
132
-
133
-
134
-
135
-
136
-
137
-
138
-
139
-
140
-
141
-
142
-
143
-
144
-
145
-
146
-
147
-
148
-
149
-
150
-
151
-
152
-
153
-
154
-
155
-
156
-
157
-
158
-
159
-
160
-
161
-
162
-
163
-
164
-
165
-
166
-
167
-
168
-
169
-
170
-
171
-
172
-
173
-
174
-
175
-
176
-
177
-
178
-
179
-
180
-
181
-
182
-
183
-
184
-
185
-
186
-
187
-
188
-
189
-
190
-
191
-
192
-
193
-
194
-
195
-
196
-
197
-
198
-
199
-
200
-
201
-
202
-
203
-
204
-
205
-
206
-
207
-
208
-
209
-
210
-
211
-
212
-
213
-
214
-
215
-
216
-
217
-
218
-
219
-
220
-
221
-
222
-
223
-
224
-
225
-
226
-
227
-
228
-
229
-
230
-
231
-
232
-
233
-
234
-
235
-
236
-
237
-
238
-
239
-
240
-
241
-
242
-
243
-
244
-
245
-
246
-
247
-
248
-
249
-
250
-
251
-
252
-
253
-
254
-
255
-
256
 |
 |
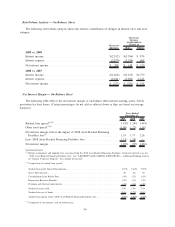
Net Interest Margin — On-Balance Sheet
The net interest margin, before 2008 Asset-Backed Financing Facilities fees, for 2009 increased 1 basis
point from 2008 and decreased 9 basis points from 2007 to 2008. These changes primarily relate to the
previously discussed changes in the on-balance sheet student loan and other asset spreads. The student loan
portfolio as a percentage of the overall interest-earning asset portfolio did not change substantially between
2009 and 2008; however, the increase in the percentage between 2008 and 2007 increased the net interest
margin by 7 basis points. This increase was more than offset for the reasons discussed above.
See “LIQUIDITY AND CAPITAL RESOURCES —Additional Funding Sources for General Corporate
Purposes — Asset-Backed Financing Facilities” for a discussion of the 2008 Asset-Backed Financing Facilities
fees and related extensions.
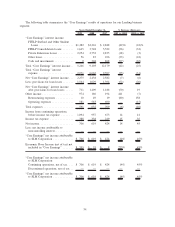
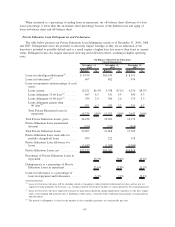
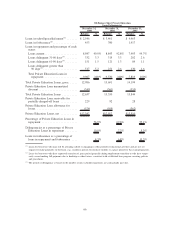
“Core Earnings” Net Interest Margin
The following table analyzes the earnings from our portfolio of Managed interest-earning assets on a
“Core Earnings” basis (see “BUSINESS SEGMENTS — Pre-tax Differences between ‘Core Earnings’ and
GAAP by Business Segment”). The “ ‘Core Earnings’ Net Interest Margin” presentation and certain
components used in the calculation differ from the “Net Interest Margin — On-Balance Sheet” presentation.
The “Core Earnings” presentation, when compared to our on-balance sheet presentation, is different in that it:
• Includes the net interest margin related to our off-balance sheet student loan securitization trusts. This
includes any related fees or costs such as the Consolidation Loan Rebate Fees, premium/discount
amortization and Repayment Borrower Benefits yield adjustments;
• Includes the reclassification of certain derivative net settlement amounts. The net settlements on certain
derivatives that do not qualify as ASC 815 hedges are recorded as part of the “gain (loss) on derivative
and hedging activities, net” line in the consolidated statements of income and are therefore not
recognized in the on-balance sheet student loan spread. Under this presentation, these gains and losses
are reclassified to the income statement line item of the economically hedged item. For our “Core
Earnings” net interest margin, this would primarily include: (a) reclassifying the net settlement amounts
related to our written Floor Income Contracts to student loan interest income and (b) reclassifying the
net settlement amounts related to certain of our basis swaps to debt interest expense;
• Excludes unhedged Floor Income and hedged Variable Rate Floor Income earned on the Managed
student loan portfolio; and
• Includes the amortization of upfront payments on Fixed Rate Floor Income Contracts in student loan
income that we believe are economically hedging the Floor Income.
58