Sallie Mae 2009 Annual Report Download - page 159
Download and view the complete annual report
Please find page 159 of the 2009 Sallie Mae annual report below. You can navigate through the pages in the report by either clicking on the pages listed below, or by using the keyword search tool below to find specific information within the annual report.-
 1
1 -
2
-
3
-
4
-
5
-
6
-
7
-
8
-
9
-
10
-
11
-
12
-
13
-
14
-
15
-
16
-
17
-
18
-
19
-
20
-
21
-
22
-
23
-
24
-
25
-
26
-
27
-
28
-
29
-
30
-
31
-
32
-
33
-
34
-
35
-
36
-
37
-
38
-
39
-
40
-
41
-
42
-
43
-
44
-
45
-
46
-
47
-
48
-
49
-
50
-
51
-
52
-
53
-
54
-
55
-
56
-
57
-
58
-
59
-
60
-
61
-
62
-
63
-
64
-
65
-
66
-
67
-
68
-
69
-
70
-
71
-
72
-
73
-
74
-
75
-
76
-
77
-
78
-
79
-
80
-
81
-
82
-
83
-
84
-
85
-
86
-
87
-
88
-
89
-
90
-
91
-
92
-
93
-
94
-
95
-
96
-
97
-
98
-
99
-
100
-
101
-
102
-
103
-
104
-
105
-
106
-
107
-
108
-
109
-
110
-
111
-
112
-
113
-
114
-
115
-
116
-
117
-
118
-
119
-
120
-
121
-
122
-
123
-
124
-
125
-
126
-
127
-
128
-
129
-
130
-
131
-
132
-
133
-
134
-
135
-
136
-
137
-
138
-
139
-
140
-
141
-
142
-
143
-
144
-
145
-
146
-
147
-
148
-
 149
149 -
 150
150 -
 151
151 -
 152
152 -
 153
153 -
 154
154 -
 155
155 -
 156
156 -
 157
157 -
 158
158 -
 159
159 -
 160
160 -
 161
161 -
 162
162 -
 163
163 -
 164
164 -
 165
165 -
 166
166 -
 167
167 -
 168
168 -
 169
169 -
170
-
171
-
172
-
173
-
174
-
175
-
176
-
177
-
178
-
179
-
180
-
181
-
182
-
183
-
184
-
185
-
186
-
187
-
188
-
189
-
190
-
191
-
192
-
193
-
194
-
195
-
196
-
197
-
198
-
199
-
200
-
201
-
202
-
203
-
204
-
205
-
206
-
207
-
208
-
209
-
210
-
211
-
212
-
213
-
214
-
215
-
216
-
217
-
218
-
219
-
220
-
221
-
222
-
223
-
224
-
225
-
226
-
227
-
228
-
229
-
230
-
231
-
232
-
233
-
234
-
235
-
236
-
237
-
238
-
239
-
240
-
241
-
242
-
243
-
244
-
245
-
246
-
247
-
248
-
249
-
250
-
251
-
252
-
253
-
254
-
255
-
256
 |
 |

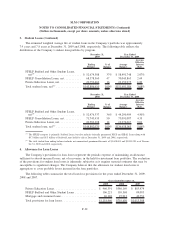
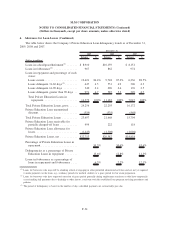
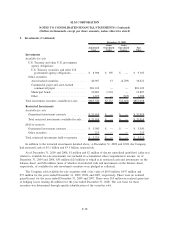
3. Student Loans (Continued)
The estimated weighted average life of student loans in the Company’s portfolio was approximately
7.9 years and 7.8 years at December 31, 2009 and 2008, respectively. The following table reflects the
distribution of the Company’s student loan portfolio by program.
Ending
Balance
%of
Balance
Average
Balance
Average
Effective
Interest
Rate
December 31,
2009
Year Ended
December 31, 2009
FFELP Stafford and Other Student Loans,
net
(1)
............................. $ 52,674,588 37% $ 58,491,748 2.07%
FFELP Consolidation Loans, net ........... 68,378,560 47 70,045,863 2.69
Private Education Loans, net .............. 22,753,462 16 23,153,975 6.83
Total student loans, net
(2)
................ $143,806,610 100% $151,691,586 3.08%
Ending
Balance
%of
Balance
Average
Balance
Average
Effective
Interest
Rate
December 31,
2008
Year Ended
December 31, 2008
FFELP Stafford and Other Student Loans,
net
(1)
............................. $ 52,476,337 36% $ 44,290,909 4.50%
FFELP Consolidation Loans, net ........... 71,743,435 50 73,091,087 4.35
Private Education Loans, net .............. 20,582,298 14 19,276,067 9.01
Total student loans, net
(2)
................ $144,802,070 100% $136,658,063 5.06%
(1)
The FFELP category is primarily Stafford Loans, but also includes federally guaranteed PLUS and HEAL Loans along with
$9.7 billion and $8.5 billion of Stafford Loans held-for-sale at December 31, 2009 and 2008, respectively.
(2)
The total student loan ending balance includes net unamortized premiums/discounts of $1,628,693 and $1,895,220 as of Decem-
ber 31, 2009 and 2008, respectively.
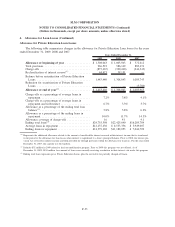
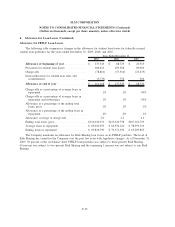
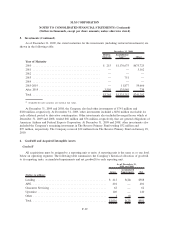
4. Allowance for Loan Losses
The Company’s provisions for loan losses represent the periodic expense of maintaining an allowance
sufficient to absorb incurred losses, net of recoveries, in the held-for-investment loan portfolios. The evaluation
of the provisions for student loan losses is inherently subjective as it requires material estimates that may be
susceptible to significant changes. The Company believes that the allowance for student loan losses is
appropriate to cover probable losses incurred in the loan portfolios.
The following tables summarize the total loan loss provisions for the years ended December 31, 2009,
2008 and 2007.
2009 2008 2007
Years Ended December 31,
Private Education Loans . .......................... $ 966,591 $586,169 $ 883,474
FFELP Stafford and Other Student Loans .............. 106,221 105,568 89,083
Mortgage and consumer loans....................... 46,148 27,913 42,751
Total provisions for loan losses ...................... $1,118,960 $719,650 $1,015,308
F-32
SLM CORPORATION
NOTES TO CONSOLIDATED FINANCIAL STATEMENTS (Continued)
(Dollars in thousands, except per share amounts, unless otherwise stated)