Sallie Mae 2009 Annual Report Download - page 118
Download and view the complete annual report
Please find page 118 of the 2009 Sallie Mae annual report below. You can navigate through the pages in the report by either clicking on the pages listed below, or by using the keyword search tool below to find specific information within the annual report.-
 1
1 -
2
-
3
-
4
-
5
-
6
-
7
-
8
-
9
-
10
-
11
-
12
-
13
-
14
-
15
-
16
-
17
-
18
-
19
-
20
-
21
-
22
-
23
-
24
-
25
-
26
-
27
-
28
-
29
-
30
-
31
-
32
-
33
-
34
-
35
-
36
-
37
-
38
-
39
-
40
-
41
-
42
-
43
-
44
-
45
-
46
-
47
-
48
-
49
-
50
-
51
-
52
-
53
-
54
-
55
-
56
-
57
-
58
-
59
-
60
-
61
-
62
-
63
-
64
-
65
-
66
-
67
-
68
-
69
-
70
-
71
-
72
-
73
-
74
-
75
-
76
-
77
-
78
-
79
-
80
-
81
-
82
-
83
-
84
-
85
-
86
-
87
-
88
-
89
-
90
-
91
-
92
-
93
-
94
-
95
-
96
-
97
-
98
-
99
-
100
-
101
-
102
-
103
-
104
-
105
-
106
-
107
-
 108
108 -
 109
109 -
 110
110 -
 111
111 -
 112
112 -
 113
113 -
 114
114 -
 115
115 -
 116
116 -
 117
117 -
 118
118 -
 119
119 -
 120
120 -
 121
121 -
 122
122 -
 123
123 -
 124
124 -
 125
125 -
 126
126 -
 127
127 -
 128
128 -
129
-
130
-
131
-
132
-
133
-
134
-
135
-
136
-
137
-
138
-
139
-
140
-
141
-
142
-
143
-
144
-
145
-
146
-
147
-
148
-
149
-
150
-
151
-
152
-
153
-
154
-
155
-
156
-
157
-
158
-
159
-
160
-
161
-
162
-
163
-
164
-
165
-
166
-
167
-
168
-
169
-
170
-
171
-
172
-
173
-
174
-
175
-
176
-
177
-
178
-
179
-
180
-
181
-
182
-
183
-
184
-
185
-
186
-
187
-
188
-
189
-
190
-
191
-
192
-
193
-
194
-
195
-
196
-
197
-
198
-
199
-
200
-
201
-
202
-
203
-
204
-
205
-
206
-
207
-
208
-
209
-
210
-
211
-
212
-
213
-
214
-
215
-
216
-
217
-
218
-
219
-
220
-
221
-
222
-
223
-
224
-
225
-
226
-
227
-
228
-
229
-
230
-
231
-
232
-
233
-
234
-
235
-
236
-
237
-
238
-
239
-
240
-
241
-
242
-
243
-
244
-
245
-
246
-
247
-
248
-
249
-
250
-
251
-
252
-
253
-
254
-
255
-
256
 |
 |

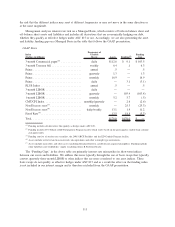
(Dollars in millions) Fair Value $ % $ %
Change from
Increase of
100 Basis
Points
Change from
Increase of
300 Basis
Points
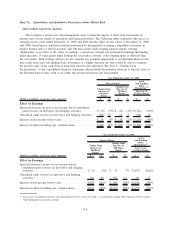
Interest Rates:
At December 31, 2009
Effect on Fair Values
Assets
Total FFELP loans ......................... $119,747 $ (470) —% $ (979) (1)%
Private Education Loans ..................... 20,278 — — — —
Other earning assets ........................ 13,472 (4) — (11) —
Other assets . . ............................ 12,506 (690) (6) (1,266) (10)
Total assets . . ............................ $166,003 $(1,164) (1)% $(2,256) (1)%
Liabilities
Interest bearing liabilities .................... $154,037 $ (852) (1)% $(2,159) (1)%
Other liabilities ........................... 3,263 (21) (1) 547 (17)
Total liabilities ............................ $157,300 $ (873) (1)% $(1,612) (1)%
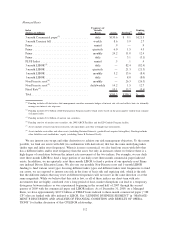
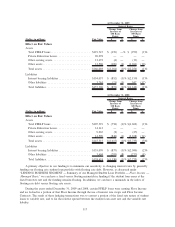
(Dollars in millions) Fair Value $ % $ %
Change from
Increase of
100 Basis
Points
Change from
Increase of
300 Basis
Points
Interest Rates:
At December 31, 2008
Effect on Fair Values
Assets
Total FFELP loans ......................... $107,319 $ (758) (1)% $(1,602) (1)%
Private Education Loans ..................... 14,141 — — — —
Other earning assets ........................ 9,265 (9) — (25) —
Other assets . . ............................ 14,590 (848) (6) (2,108) (14)
Total assets . . ............................ $145,315 $(1,615) (1)% $(3,735) (3)%
Liabilities
Interest bearing liabilities .................... $135,070 $ (837) (1)% $(2,500) (2)%
Other liabilities ........................... 3,604 (293) (8) (273) (8)
Total liabilities ............................ $138,674 $(1,130) (1)% $(2,773) (2)%
A primary objective in our funding is to minimize our sensitivity to changing interest rates by generally
funding our floating rate student loan portfolio with floating rate debt. However, as discussed under
“LENDING BUSINESS SEGMENT — Summary of our Managed Student Loan Portfolio — Floor Income —
Managed Basis,” we can have a fixed versus floating mismatch in funding if the student loan earns at the
fixed borrower rate and the funding remains floating. In addition, we can have a mismatch in the index of
floating rate debt versus floating rate assets.
During the years ended December 31, 2009 and 2008, certain FFELP loans were earning Floor Income
and we locked in a portion of that Floor Income through the use of interest rate swaps and Floor Income
Contracts. The result of these hedging transactions was to convert a portion of the fixed rate nature of student
loans to variable rate, and to fix the relative spread between the student loan asset rate and the variable rate
liability.
117