Sallie Mae 2009 Annual Report Download - page 234
Download and view the complete annual report
Please find page 234 of the 2009 Sallie Mae annual report below. You can navigate through the pages in the report by either clicking on the pages listed below, or by using the keyword search tool below to find specific information within the annual report.-
 1
1 -
2
-
3
-
4
-
5
-
6
-
7
-
8
-
9
-
10
-
11
-
12
-
13
-
14
-
15
-
16
-
17
-
18
-
19
-
20
-
21
-
22
-
23
-
24
-
25
-
26
-
27
-
28
-
29
-
30
-
31
-
32
-
33
-
34
-
35
-
36
-
37
-
38
-
39
-
40
-
41
-
42
-
43
-
44
-
45
-
46
-
47
-
48
-
49
-
50
-
51
-
52
-
53
-
54
-
55
-
56
-
57
-
58
-
59
-
60
-
61
-
62
-
63
-
64
-
65
-
66
-
67
-
68
-
69
-
70
-
71
-
72
-
73
-
74
-
75
-
76
-
77
-
78
-
79
-
80
-
81
-
82
-
83
-
84
-
85
-
86
-
87
-
88
-
89
-
90
-
91
-
92
-
93
-
94
-
95
-
96
-
97
-
98
-
99
-
100
-
101
-
102
-
103
-
104
-
105
-
106
-
107
-
108
-
109
-
110
-
111
-
112
-
113
-
114
-
115
-
116
-
117
-
118
-
119
-
120
-
121
-
122
-
123
-
124
-
125
-
126
-
127
-
128
-
129
-
130
-
131
-
132
-
133
-
134
-
135
-
136
-
137
-
138
-
139
-
140
-
141
-
142
-
143
-
144
-
145
-
146
-
147
-
148
-
149
-
150
-
151
-
152
-
153
-
154
-
155
-
156
-
157
-
158
-
159
-
160
-
161
-
162
-
163
-
164
-
165
-
166
-
167
-
168
-
169
-
170
-
171
-
172
-
173
-
174
-
175
-
176
-
177
-
178
-
179
-
180
-
181
-
182
-
183
-
184
-
185
-
186
-
187
-
188
-
189
-
190
-
191
-
192
-
193
-
194
-
195
-
196
-
197
-
198
-
199
-
200
-
201
-
202
-
203
-
204
-
205
-
206
-
207
-
208
-
209
-
210
-
211
-
212
-
213
-
214
-
215
-
216
-
217
-
218
-
219
-
220
-
221
-
222
-
223
-
 224
224 -
 225
225 -
 226
226 -
 227
227 -
 228
228 -
 229
229 -
 230
230 -
 231
231 -
 232
232 -
 233
233 -
 234
234 -
 235
235 -
 236
236 -
 237
237 -
 238
238 -
 239
239 -
 240
240 -
 241
241 -
 242
242 -
 243
243 -
 244
244 -
245
-
246
-
247
-
248
-
249
-
250
-
251
-
252
-
253
-
254
-
255
-
256
 |
 |

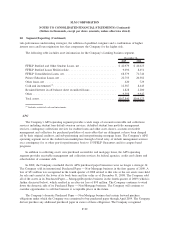
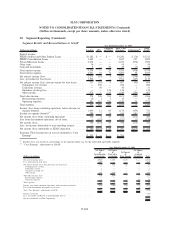
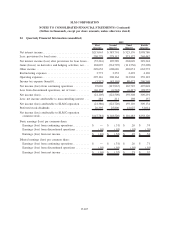
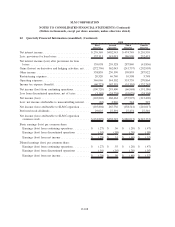
22. Quarterly Financial Information (unaudited)
First
Quarter
Second
Quarter
Third
Quarter
Fourth
Quarter
2009
Net interest income .............................. $215,063 $ 383,701 $ 525,176 $598,786
Less: provisions for loan losses ..................... 250,279 278,112 321,127 269,442
Net interest income (loss) after provisions for loan losses. . (35,216) 105,589 204,049 329,344
Gains (losses) on derivative and hedging activities, net .... 104,025 (561,795) (111,556) (35,209)
Other income .................................. 249,632 608,626 469,051 663,572
Restructuring expenses ........................... 3,773 3,333 2,492 4,169
Operating expenses .............................. 295,116 308,164 312,904 339,122
Income tax expense (benefit) ....................... (5,517) (43,110) 80,423 206,568
Net income (loss) from continuing operations .......... 25,069 (115,967) 165,725 407,848
Loss from discontinued operations, net of taxes ......... (46,174) (6,542) (6,417) (98,557)
Net income (loss) ............................... (21,105) (122,509) 159,308 309,291
Less: net income attributable to noncontrolling interest . . . 281 211 198 157
Net income (loss) attributable to SLM Corporation ...... (21,386) (122,720) 159,110 309,134
Preferred stock dividends ......................... 26,395 25,800 42,627 51,014
Net income (loss) attributable to SLM Corporation
common stock................................ $(47,781) $(148,520) $ 116,483 $258,120
Basic earnings (loss) per common share:
Earnings (loss) from continuing operations. .......... $ — $ (.31) $ .26 $ .74
Earnings (loss) from discontinued operations ......... (.10) (.01) (.01) (.20)
Earnings (loss) from net income .................. $ (.10) $ (.32) $ .25 $ .54
Diluted earnings (loss) per common share:
Earnings (loss) from continuing operations. .......... $ — $ (.31) $ .26 $ .71
Earnings (loss) from discontinued operations ......... (.10) (.01) (.01) (.19)
Earnings (loss) from net income .................. $ (.10) $ (.32) $ .25 $ .52
F-107
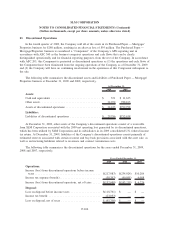
SLM CORPORATION
NOTES TO CONSOLIDATED FINANCIAL STATEMENTS (Continued)
(Dollars in thousands, except per share amounts, unless otherwise stated)