Sallie Mae 2009 Annual Report Download - page 86
Download and view the complete annual report
Please find page 86 of the 2009 Sallie Mae annual report below. You can navigate through the pages in the report by either clicking on the pages listed below, or by using the keyword search tool below to find specific information within the annual report.-
 1
1 -
2
-
3
-
4
-
5
-
6
-
7
-
8
-
9
-
10
-
11
-
12
-
13
-
14
-
15
-
16
-
17
-
18
-
19
-
20
-
21
-
22
-
23
-
24
-
25
-
26
-
27
-
28
-
29
-
30
-
31
-
32
-
33
-
34
-
35
-
36
-
37
-
38
-
39
-
40
-
41
-
42
-
43
-
44
-
45
-
46
-
47
-
48
-
49
-
50
-
51
-
52
-
53
-
54
-
55
-
56
-
57
-
58
-
59
-
60
-
61
-
62
-
63
-
64
-
65
-
66
-
67
-
68
-
69
-
70
-
71
-
72
-
73
-
74
-
75
-
 76
76 -
 77
77 -
 78
78 -
 79
79 -
 80
80 -
 81
81 -
 82
82 -
 83
83 -
 84
84 -
 85
85 -
 86
86 -
 87
87 -
 88
88 -
 89
89 -
 90
90 -
 91
91 -
 92
92 -
 93
93 -
 94
94 -
 95
95 -
 96
96 -
97
-
98
-
99
-
100
-
101
-
102
-
103
-
104
-
105
-
106
-
107
-
108
-
109
-
110
-
111
-
112
-
113
-
114
-
115
-
116
-
117
-
118
-
119
-
120
-
121
-
122
-
123
-
124
-
125
-
126
-
127
-
128
-
129
-
130
-
131
-
132
-
133
-
134
-
135
-
136
-
137
-
138
-
139
-
140
-
141
-
142
-
143
-
144
-
145
-
146
-
147
-
148
-
149
-
150
-
151
-
152
-
153
-
154
-
155
-
156
-
157
-
158
-
159
-
160
-
161
-
162
-
163
-
164
-
165
-
166
-
167
-
168
-
169
-
170
-
171
-
172
-
173
-
174
-
175
-
176
-
177
-
178
-
179
-
180
-
181
-
182
-
183
-
184
-
185
-
186
-
187
-
188
-
189
-
190
-
191
-
192
-
193
-
194
-
195
-
196
-
197
-
198
-
199
-
200
-
201
-
202
-
203
-
204
-
205
-
206
-
207
-
208
-
209
-
210
-
211
-
212
-
213
-
214
-
215
-
216
-
217
-
218
-
219
-
220
-
221
-
222
-
223
-
224
-
225
-
226
-
227
-
228
-
229
-
230
-
231
-
232
-
233
-
234
-
235
-
236
-
237
-
238
-
239
-
240
-
241
-
242
-
243
-
244
-
245
-
246
-
247
-
248
-
249
-
250
-
251
-
252
-
253
-
254
-
255
-
256
 |
 |

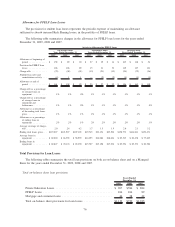
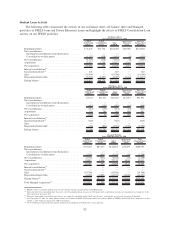
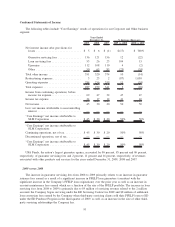
Other Income — Lending Business Segment
The following table summarizes the components of other income, net, for our Lending business segment
for the years ended December 31, 2009, 2008 and 2007.
2009 2008 2007
Years Ended
December 31,
Gains on debt repurchases ...................................... $536 $ 64 $ —
Gains (losses) on sales of loans and securities, net .................... 284 (51) 24
Late fees and forbearance fees ................................... 146 143 134
Gains on sales of mortgages and other loan fees...................... — 3 11
Other ..................................................... 8 21 25
Total other income, net ........................................ $974 $180 $194
The change in other income over the prior periods presented is primarily the result of the gains on debt
repurchased and gains on sales of loans. The Company began repurchasing its outstanding debt in the second
quarter of 2008. The Company repurchased $3.4 billion and $1.9 billion face amount of its senior unsecured
notes during the years ended December 31, 2009 and 2008, respectively. Since the second quarter of 2008, the
Company repurchased $5.3 billion face amount of its senior unsecured notes in the aggregate, with maturity
dates ranging from 2008 to 2016. The $284 million of gains on sales of loans and securities, net, in the year
ended December 31, 2009 related to the sale of approximately $18.5 billion face amount of FFELP loans to
the ED as part of the Purchase Program. The loss in 2008 primarily relates to the sale of approximately
$1.0 billion FFELP loans to ED under ECASLA, which resulted in a $53 million loss.
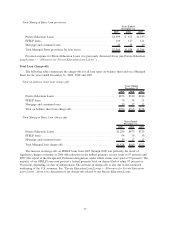
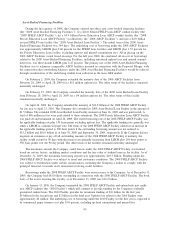
Operating Expenses — Lending Business Segment
The following table summarizes the components of operating expenses for our Lending business segment
for the years ended December 31, 2009, 2008 and 2007.
2009 2008 2007
Years Ended
December 31,
Sales and originations ......................................... $212 $235 $351
Servicing .................................................. 266 237 227
Corporate overhead ........................................... 103 111 112
Total operating expenses ....................................... $581 $583 $690
Operating expenses for our Lending business segment include costs incurred to service our Managed
student loan portfolio and acquire student loans, as well as other general and administrative expenses.
2009 versus 2008
Operating expenses for the year ended December 31, 2009, remained relatively unchanged from the prior
year. In 2009, operating expenses were higher as a result of higher collection costs from a higher number of
loans in repayment and delinquent status and higher direct-to-consumer marketing costs related to Private
Education Loans. These increases in operating expenses were offset primarily by the full-year effect of the
Company’s cost reduction efforts conducted throughout 2008.
2008 versus 2007
Operating expenses for the year ended December 31, 2008, decreased by 16 percent from 2007. The
decrease is primarily due to the impact of our cost reduction efforts and to the suspension of certain student
loan programs.
85