Sallie Mae 2009 Annual Report Download - page 8
Download and view the complete annual report
Please find page 8 of the 2009 Sallie Mae annual report below. You can navigate through the pages in the report by either clicking on the pages listed below, or by using the keyword search tool below to find specific information within the annual report.-
 1
1 -
 2
2 -
 3
3 -
 4
4 -
 5
5 -
 6
6 -
 7
7 -
 8
8 -
 9
9 -
 10
10 -
 11
11 -
 12
12 -
 13
13 -
 14
14 -
 15
15 -
 16
16 -
 17
17 -
 18
18 -
 19
19 -
20
-
21
-
22
-
23
-
24
-
25
-
26
-
27
-
28
-
29
-
30
-
31
-
32
-
33
-
34
-
35
-
36
-
37
-
38
-
39
-
40
-
41
-
42
-
43
-
44
-
45
-
46
-
47
-
48
-
49
-
50
-
51
-
52
-
53
-
54
-
55
-
56
-
57
-
58
-
59
-
60
-
61
-
62
-
63
-
64
-
65
-
66
-
67
-
68
-
69
-
70
-
71
-
72
-
73
-
74
-
75
-
76
-
77
-
78
-
79
-
80
-
81
-
82
-
83
-
84
-
85
-
86
-
87
-
88
-
89
-
90
-
91
-
92
-
93
-
94
-
95
-
96
-
97
-
98
-
99
-
100
-
101
-
102
-
103
-
104
-
105
-
106
-
107
-
108
-
109
-
110
-
111
-
112
-
113
-
114
-
115
-
116
-
117
-
118
-
119
-
120
-
121
-
122
-
123
-
124
-
125
-
126
-
127
-
128
-
129
-
130
-
131
-
132
-
133
-
134
-
135
-
136
-
137
-
138
-
139
-
140
-
141
-
142
-
143
-
144
-
145
-
146
-
147
-
148
-
149
-
150
-
151
-
152
-
153
-
154
-
155
-
156
-
157
-
158
-
159
-
160
-
161
-
162
-
163
-
164
-
165
-
166
-
167
-
168
-
169
-
170
-
171
-
172
-
173
-
174
-
175
-
176
-
177
-
178
-
179
-
180
-
181
-
182
-
183
-
184
-
185
-
186
-
187
-
188
-
189
-
190
-
191
-
192
-
193
-
194
-
195
-
196
-
197
-
198
-
199
-
200
-
201
-
202
-
203
-
204
-
205
-
206
-
207
-
208
-
209
-
210
-
211
-
212
-
213
-
214
-
215
-
216
-
217
-
218
-
219
-
220
-
221
-
222
-
223
-
224
-
225
-
226
-
227
-
228
-
229
-
230
-
231
-
232
-
233
-
234
-
235
-
236
-
237
-
238
-
239
-
240
-
241
-
242
-
243
-
244
-
245
-
246
-
247
-
248
-
249
-
250
-
251
-
252
-
253
-
254
-
255
-
256
 |
 |
Over the course of 2009, we made improvements in the structure, pricing, underwriting, servicing,
collecting and funding of Private Education Loans. These changes were made to increase the profitability and
decrease the risk of the product. For example, the average FICO score for loans disbursed in 2009 was up 19
points to 745 and the percentage of co-signed loans increased to 84 percent from 66 percent in the prior year.
These improvements in portfolio quality are being driven primarily by our more selective underwriting
criteria. We have instituted higher FICO cut-offs and require cosigners for borrowers with higher credit scores
than in the past. Our experience shows that adding a cosigner to a loan reduces the default rate by more than
50 percent. We are capturing more data on our borrowers and cosigners and using this data in the credit
decision and pricing process. In 2009, we began using a new Custom Underwriting Scorecard, that we believe
will further improve our underwriting. We have also introduced judgmental lending.
In 2009, we introduced the Smart Option Student Loan», which is offered to undergraduate and graduate
students through the financial aid offices of colleges and universities to supplement traditional federal loans.
The Smart Option Student Loan»significantly reduces the customer’s total cost and repayment term by
requiring interest payments while the student is in school.
Competition
Historically, we have faced competition for both federally guaranteed and non-guaranteed student loans
from a variety of financial institutions, including banks, thrifts and state-supported secondary markets.
However, as a result of the CCRAA which was passed in 2007, the legislation currently pending and the
dislocation in the capital markets, the student loan industry is undergoing a significant transition. A number of
student lenders have ceased operations altogether or curtailed activity.
ASSET PERFORMANCE GROUP BUSINESS SEGMENT
In our APG business segment, we provide student loan default aversion services, defaulted student loan
portfolio management services and contingency collections services for student loans and other asset classes.
In 2008, we decided to wind down our accounts receivable management and collections services on consumer
and mortgage receivable portfolios. We made this decision because we did not realize the expected synergies
between this business and our traditional contingent student loan collection business. During 2009 we sold
GRP, our mortgage purchased paper company, and wound down our unsecured receivables portfolio to
$285 million.
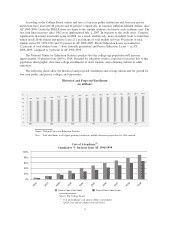
In 2009, our APG business segment had revenues totaling $346 million and a net loss of $154 million
due to impairments in our collections servicing portfolios. Our largest customer, USA Funds, accounted for
39 percent, excluding impairments, of our revenue in this segment in 2009.
Please read the section “Recent Developments and Expected Future Trends”to see how pending
legislation could impact this business segment.
Products and Services
Student Loan Default Aversion Services
We provide default aversion services for five Guarantors, including the nation’s largest, USA Funds.
These services are designed to prevent a default once a borrower’s loan has been placed in delinquency status.
Defaulted Student Loan Portfolio Management Services
Our APG business segment manages the defaulted student loan portfolios for six Guarantors under long-
term contracts. APG’s largest customer, USA Funds, represents approximately 17 percent of defaulted student
loan portfolios we manage. Our portfolio management services include selecting collection agencies and
determining account placements to those agencies, processing loan consolidations and loan rehabilitations, and
managing federal and state offset programs.
7