Sallie Mae 2009 Annual Report Download - page 56
Download and view the complete annual report
Please find page 56 of the 2009 Sallie Mae annual report below. You can navigate through the pages in the report by either clicking on the pages listed below, or by using the keyword search tool below to find specific information within the annual report.-
 1
1 -
2
-
3
-
4
-
5
-
6
-
7
-
8
-
9
-
10
-
11
-
12
-
13
-
14
-
15
-
16
-
17
-
18
-
19
-
20
-
21
-
22
-
23
-
24
-
25
-
26
-
27
-
28
-
29
-
30
-
31
-
32
-
33
-
34
-
35
-
36
-
37
-
38
-
39
-
40
-
41
-
42
-
43
-
44
-
45
-
 46
46 -
 47
47 -
 48
48 -
 49
49 -
 50
50 -
 51
51 -
 52
52 -
 53
53 -
 54
54 -
 55
55 -
 56
56 -
 57
57 -
 58
58 -
 59
59 -
 60
60 -
 61
61 -
 62
62 -
 63
63 -
 64
64 -
 65
65 -
 66
66 -
67
-
68
-
69
-
70
-
71
-
72
-
73
-
74
-
75
-
76
-
77
-
78
-
79
-
80
-
81
-
82
-
83
-
84
-
85
-
86
-
87
-
88
-
89
-
90
-
91
-
92
-
93
-
94
-
95
-
96
-
97
-
98
-
99
-
100
-
101
-
102
-
103
-
104
-
105
-
106
-
107
-
108
-
109
-
110
-
111
-
112
-
113
-
114
-
115
-
116
-
117
-
118
-
119
-
120
-
121
-
122
-
123
-
124
-
125
-
126
-
127
-
128
-
129
-
130
-
131
-
132
-
133
-
134
-
135
-
136
-
137
-
138
-
139
-
140
-
141
-
142
-
143
-
144
-
145
-
146
-
147
-
148
-
149
-
150
-
151
-
152
-
153
-
154
-
155
-
156
-
157
-
158
-
159
-
160
-
161
-
162
-
163
-
164
-
165
-
166
-
167
-
168
-
169
-
170
-
171
-
172
-
173
-
174
-
175
-
176
-
177
-
178
-
179
-
180
-
181
-
182
-
183
-
184
-
185
-
186
-
187
-
188
-
189
-
190
-
191
-
192
-
193
-
194
-
195
-
196
-
197
-
198
-
199
-
200
-
201
-
202
-
203
-
204
-
205
-
206
-
207
-
208
-
209
-
210
-
211
-
212
-
213
-
214
-
215
-
216
-
217
-
218
-
219
-
220
-
221
-
222
-
223
-
224
-
225
-
226
-
227
-
228
-
229
-
230
-
231
-
232
-
233
-
234
-
235
-
236
-
237
-
238
-
239
-
240
-
241
-
242
-
243
-
244
-
245
-
246
-
247
-
248
-
249
-
250
-
251
-
252
-
253
-
254
-
255
-
256
 |
 |

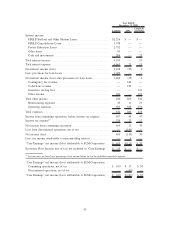
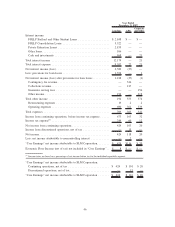
Net Interest Income
Changes in net interest income are primarily due to fluctuations in the student loan and other asset spread
discussed below, the growth of our student loan portfolio, and changes in the level of cash and investments we
hold on our balance sheet for liquidity purposes.
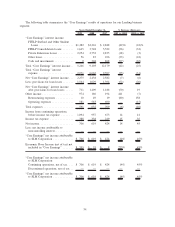
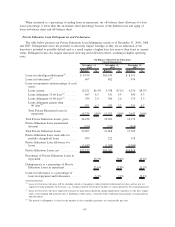
Average Balance Sheets — On-Balance Sheet
The following table reflects the rates earned on interest-earning assets and paid on interest-bearing
liabilities for the years ended December 31, 2009, 2008 and 2007. This table reflects the net interest margin
for the entire Company for our on-balance sheet assets. It is included in the Lending business segment
discussion because the Lending business segment includes substantially all interest-earning assets and interest-
bearing liabilities.
Balance Rate Balance Rate Balance Rate
2009 2008 2007
Years Ended December 31,
Average Assets
FFELP Stafford and Other Student
Loans ....................... $ 58,492 2.07% $ 44,291 4.50% $ 31,294 6.59%
FFELP Consolidation Loans ........ 70,046 2.69 73,091 4.35 67,918 6.39
Private Education Loans ........... 23,154 6.83 19,276 9.01 12,507 11.65
Other loans ..................... 561 9.98 955 8.66 1,246 8.49
Cash and investments ............. 11,046 .24 9,279 2.98 12,710 5.57
Total interest-earning assets ......... 163,299 2.91% 146,892 4.95% 125,675 6.90%
Non-interest-earning assets ......... 8,693 9,999 9,715
Total assets ..................... $171,992 $156,891 $135,390
Average Liabilities and
Stockholders’ Equity
Short-term borrowings............. $ 44,485 1.84% $ 36,059 4.73% $ 16,385 5.74%
Long-term borrowings............. 118,699 1.87 111,625 3.76 109,984 5.59
Total interest-bearing liabilities . . . . . . 163,184 1.86% 147,684 4.00% 126,369 5.61%
Non-interest-bearing liabilities ....... 3,719 3,797 4,272
Stockholders’ equity .............. 5,089 5,410 4,749
Total liabilities and stockholders’
equity ....................... $171,992 $156,891 $135,390
Net interest margin ............... 1.05% .93% 1.26%
55