Sallie Mae 2009 Annual Report Download - page 216
Download and view the complete annual report
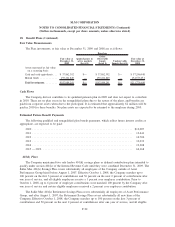
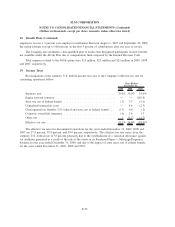
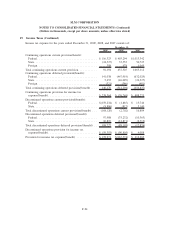
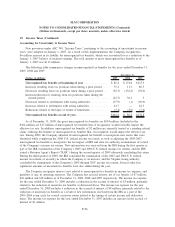
Please find page 216 of the 2009 Sallie Mae annual report below. You can navigate through the pages in the report by either clicking on the pages listed below, or by using the keyword search tool below to find specific information within the annual report.-
 1
1 -
2
-
3
-
4
-
5
-
6
-
7
-
8
-
9
-
10
-
11
-
12
-
13
-
14
-
15
-
16
-
17
-
18
-
19
-
20
-
21
-
22
-
23
-
24
-
25
-
26
-
27
-
28
-
29
-
30
-
31
-
32
-
33
-
34
-
35
-
36
-
37
-
38
-
39
-
40
-
41
-
42
-
43
-
44
-
45
-
46
-
47
-
48
-
49
-
50
-
51
-
52
-
53
-
54
-
55
-
56
-
57
-
58
-
59
-
60
-
61
-
62
-
63
-
64
-
65
-
66
-
67
-
68
-
69
-
70
-
71
-
72
-
73
-
74
-
75
-
76
-
77
-
78
-
79
-
80
-
81
-
82
-
83
-
84
-
85
-
86
-
87
-
88
-
89
-
90
-
91
-
92
-
93
-
94
-
95
-
96
-
97
-
98
-
99
-
100
-
101
-
102
-
103
-
104
-
105
-
106
-
107
-
108
-
109
-
110
-
111
-
112
-
113
-
114
-
115
-
116
-
117
-
118
-
119
-
120
-
121
-
122
-
123
-
124
-
125
-
126
-
127
-
128
-
129
-
130
-
131
-
132
-
133
-
134
-
135
-
136
-
137
-
138
-
139
-
140
-
141
-
142
-
143
-
144
-
145
-
146
-
147
-
148
-
149
-
150
-
151
-
152
-
153
-
154
-
155
-
156
-
157
-
158
-
159
-
160
-
161
-
162
-
163
-
164
-
165
-
166
-
167
-
168
-
169
-
170
-
171
-
172
-
173
-
174
-
175
-
176
-
177
-
178
-
179
-
180
-
181
-
182
-
183
-
184
-
185
-
186
-
187
-
188
-
189
-
190
-
191
-
192
-
193
-
194
-
195
-
196
-
197
-
198
-
199
-
200
-
201
-
202
-
203
-
204
-
205
-
 206
206 -
 207
207 -
 208
208 -
 209
209 -
 210
210 -
 211
211 -
 212
212 -
 213
213 -
 214
214 -
 215
215 -
 216
216 -
 217
217 -
 218
218 -
 219
219 -
 220
220 -
 221
221 -
 222
222 -
 223
223 -
 224
224 -
 225
225 -
 226
226 -
227
-
228
-
229
-
230
-
231
-
232
-
233
-
234
-
235
-
236
-
237
-
238
-
239
-
240
-
241
-
242
-
243
-
244
-
245
-
246
-
247
-
248
-
249
-
250
-
251
-
252
-
253
-
254
-
255
-
256
 |
 |

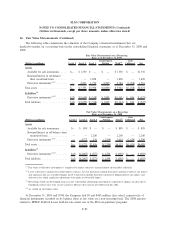
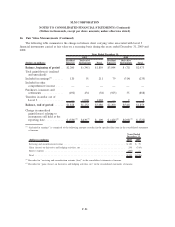
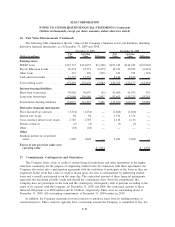
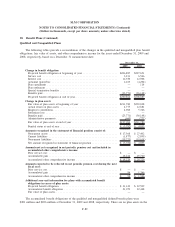
18. Benefit Plans (Continued)
Qualified and Nonqualified Plans
The following tables provide a reconciliation of the changes in the qualified and nonqualified plan benefit
obligations, fair value of assets, and other comprehensive income for the years ended December 31, 2009 and
2008, respectively, based on a December 31 measurement date:
2009 2008
December 31,
Change in benefit obligation
Projected benefit obligation at beginning of year . . ..................... $206,887 $227,651
Service cost . ................................................ 3,231 6,566
Interest cost . ................................................ 12,350 12,908
Actuarial (gain)/loss . .......................................... 2,169 (4,204)
Plan curtailment .............................................. — 114
Plan settlement ............................................... — —
Special termination benefits . ..................................... — —
Benefits paid . ................................................ (23,771) (36,148)
Projected benefit obligation at end of year. . .......................... $200,866 $206,887
Change in plan assets
Fair value of plan assets at beginning of year ......................... $211,780 $230,698
Actual return on plan assets . ..................................... 4,775 12,681
Employer contribution .......................................... 4,960 5,326
Settlement loss ............................................... — —
Benefits paid . ................................................ (23,771) (36,148)
Administrative payments . . . ..................................... (660) (777)
Fair value of plan assets at end of year .............................. $197,084 $211,780
Funded status at end of year. ..................................... $ (3,782) $ 4,893
Amounts recognized in the statement of financial position consist of:
Noncurrent assets . . . .......................................... $ 17,368 $ 27,402
Current liabilities . . . .......................................... (1,877) (2,895)
Noncurrent liabilities . .......................................... (19,273) (19,614)
Net amount recognized in statement of financial position . . ............... $ (3,782) $ 4,893
Amounts not yet recognized in net periodic pension cost and included in
accumulated other comprehensive income:
Prior service cost.............................................. $ — $ —
Accumulated gain . . . .......................................... 18,224 29,720
Accumulated other comprehensive income . .......................... $ 18,224 $ 29,720
Amounts expected to be reflected in net periodic pension cost during the next
fiscal year:
Prior service cost.............................................. $ — $ —
Accumulated gain . . . .......................................... 96 1,366
Accumulated other comprehensive income . .......................... $ 96 $ 1,366
Additional year-end information for plans with accumulated benefit
obligations in excess of plan assets:
Projected benefit obligation . ..................................... $ 21,149 $ 22,509
Accumulated benefit obligation . . . ................................ 21,079 22,448
Fair value of plan assets......................................... — —
The accumulated benefit obligations of the qualified and nonqualified defined benefit plans were
$201 million and $206 million at December 31, 2009 and 2008, respectively. There are no plan assets in the
F-89
SLM CORPORATION
NOTES TO CONSOLIDATED FINANCIAL STATEMENTS (Continued)
(Dollars in thousands, except per share amounts, unless otherwise stated)