Sallie Mae 2009 Annual Report Download - page 92
Download and view the complete annual report
Please find page 92 of the 2009 Sallie Mae annual report below. You can navigate through the pages in the report by either clicking on the pages listed below, or by using the keyword search tool below to find specific information within the annual report.-
 1
1 -
2
-
3
-
4
-
5
-
6
-
7
-
8
-
9
-
10
-
11
-
12
-
13
-
14
-
15
-
16
-
17
-
18
-
19
-
20
-
21
-
22
-
23
-
24
-
25
-
26
-
27
-
28
-
29
-
30
-
31
-
32
-
33
-
34
-
35
-
36
-
37
-
38
-
39
-
40
-
41
-
42
-
43
-
44
-
45
-
46
-
47
-
48
-
49
-
50
-
51
-
52
-
53
-
54
-
55
-
56
-
57
-
58
-
59
-
60
-
61
-
62
-
63
-
64
-
65
-
66
-
67
-
68
-
69
-
70
-
71
-
72
-
73
-
74
-
75
-
76
-
77
-
78
-
79
-
80
-
81
-
 82
82 -
 83
83 -
 84
84 -
 85
85 -
 86
86 -
 87
87 -
 88
88 -
 89
89 -
 90
90 -
 91
91 -
 92
92 -
 93
93 -
 94
94 -
 95
95 -
 96
96 -
 97
97 -
 98
98 -
 99
99 -
 100
100 -
 101
101 -
 102
102 -
103
-
104
-
105
-
106
-
107
-
108
-
109
-
110
-
111
-
112
-
113
-
114
-
115
-
116
-
117
-
118
-
119
-
120
-
121
-
122
-
123
-
124
-
125
-
126
-
127
-
128
-
129
-
130
-
131
-
132
-
133
-
134
-
135
-
136
-
137
-
138
-
139
-
140
-
141
-
142
-
143
-
144
-
145
-
146
-
147
-
148
-
149
-
150
-
151
-
152
-
153
-
154
-
155
-
156
-
157
-
158
-
159
-
160
-
161
-
162
-
163
-
164
-
165
-
166
-
167
-
168
-
169
-
170
-
171
-
172
-
173
-
174
-
175
-
176
-
177
-
178
-
179
-
180
-
181
-
182
-
183
-
184
-
185
-
186
-
187
-
188
-
189
-
190
-
191
-
192
-
193
-
194
-
195
-
196
-
197
-
198
-
199
-
200
-
201
-
202
-
203
-
204
-
205
-
206
-
207
-
208
-
209
-
210
-
211
-
212
-
213
-
214
-
215
-
216
-
217
-
218
-
219
-
220
-
221
-
222
-
223
-
224
-
225
-
226
-
227
-
228
-
229
-
230
-
231
-
232
-
233
-
234
-
235
-
236
-
237
-
238
-
239
-
240
-
241
-
242
-
243
-
244
-
245
-
246
-
247
-
248
-
249
-
250
-
251
-
252
-
253
-
254
-
255
-
256
 |
 |

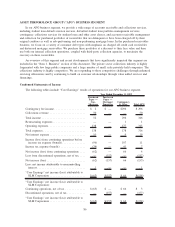
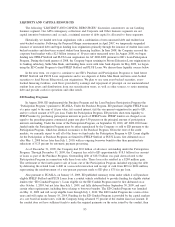
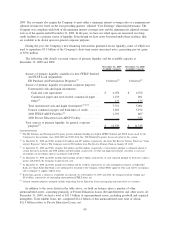
Condensed Statements of Income
The following tables include “Core Earnings” results of operations for our Corporate and Other business
segment.
2009 2008 2007 2009 vs. 2008 2008 vs. 2007
Years Ended
December 31, % Increase (Decrease)
Net interest income after provisions for
losses ............................. $ 5 $ 6 $ (1) $(17) $ 700%
Guarantor servicing fees ............... 136 121 156 12 (22)
Loan servicing fees ................... 53 26 23 104 13
Upromise .......................... 112 108 110 4 (2)
Other ............................. 50 65 85 (23) (24)
Total other income ..................... 351 320 374 10 (14)
Restructuring expenses .................. 3 23 2 (87) 1,050
Operating expenses ..................... 284 256 339 11 (24)
Total expenses ........................ 287 279 341 3 (18)
Income from continuing operations, before
income tax expense ................... 69 47 32 47 47
Income tax expense .................... 24 17 12 41 42
Net income........................... 45 30 20 50 50
Less: net income attributable to noncontrolling
interest ............................ — — — — —
“Core Earnings” net income attributable to
SLM Corporation .................... $ 45 $ 30 $ 20 50% 50%
“Core Earnings” net income attributable to
SLM Corporation:
Continuing operations, net of tax........... $ 45 $ 30 $ 20 50% 50%
Discontinued operations, net of tax ......... — — — — —
“Core Earnings” net income attributable to
SLM Corporation .................... $ 45 $ 30 $ 20 50% 50%
USA Funds, the nation’s largest guarantee agency, accounted for 86 percent, 85 percent and 86 percent,
respectively, of guarantor servicing fees and 2 percent, 11 percent and 16 percent, respectively, of revenues
associated with other products and services for the years ended December 31, 2009, 2008 and 2007.
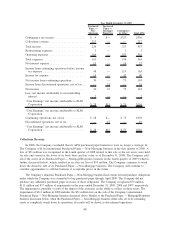
2009 versus 2008
The increase in guarantor servicing fees from 2008 to 2009 primarily relates to an increase in guarantor
issuance fees earned as a result of a significant increase in FFELP loan guarantees (consistent with the
significant increase in the Company’s FFELP loan originations) over the prior year as well as an increase in
account maintenance fees earned which are a function of the size of the FFELP portfolio. The increase in loan
servicing fees from 2008 to 2009 is primarily due to $9 million of servicing revenue related to the 2 million
accounts the Company began servicing under the ED Servicing Contract in 2009 and $8 million of additional
loan conversion fees earned by the Company when third-party servicing clients sold their FFELP loans to ED
under the ED Purchase Program in the third quarter of 2009, as well as an increase in the size of other third-
party servicing relationships the Company has.
91