Sallie Mae 2009 Annual Report Download - page 203
Download and view the complete annual report
Please find page 203 of the 2009 Sallie Mae annual report below. You can navigate through the pages in the report by either clicking on the pages listed below, or by using the keyword search tool below to find specific information within the annual report.-
 1
1 -
2
-
3
-
4
-
5
-
6
-
7
-
8
-
9
-
10
-
11
-
12
-
13
-
14
-
15
-
16
-
17
-
18
-
19
-
20
-
21
-
22
-
23
-
24
-
25
-
26
-
27
-
28
-
29
-
30
-
31
-
32
-
33
-
34
-
35
-
36
-
37
-
38
-
39
-
40
-
41
-
42
-
43
-
44
-
45
-
46
-
47
-
48
-
49
-
50
-
51
-
52
-
53
-
54
-
55
-
56
-
57
-
58
-
59
-
60
-
61
-
62
-
63
-
64
-
65
-
66
-
67
-
68
-
69
-
70
-
71
-
72
-
73
-
74
-
75
-
76
-
77
-
78
-
79
-
80
-
81
-
82
-
83
-
84
-
85
-
86
-
87
-
88
-
89
-
90
-
91
-
92
-
93
-
94
-
95
-
96
-
97
-
98
-
99
-
100
-
101
-
102
-
103
-
104
-
105
-
106
-
107
-
108
-
109
-
110
-
111
-
112
-
113
-
114
-
115
-
116
-
117
-
118
-
119
-
120
-
121
-
122
-
123
-
124
-
125
-
126
-
127
-
128
-
129
-
130
-
131
-
132
-
133
-
134
-
135
-
136
-
137
-
138
-
139
-
140
-
141
-
142
-
143
-
144
-
145
-
146
-
147
-
148
-
149
-
150
-
151
-
152
-
153
-
154
-
155
-
156
-
157
-
158
-
159
-
160
-
161
-
162
-
163
-
164
-
165
-
166
-
167
-
168
-
169
-
170
-
171
-
172
-
173
-
174
-
175
-
176
-
177
-
178
-
179
-
180
-
181
-
182
-
183
-
184
-
185
-
186
-
187
-
188
-
189
-
190
-
191
-
192
-
 193
193 -
 194
194 -
 195
195 -
 196
196 -
 197
197 -
 198
198 -
 199
199 -
 200
200 -
 201
201 -
 202
202 -
 203
203 -
 204
204 -
 205
205 -
 206
206 -
 207
207 -
 208
208 -
 209
209 -
 210
210 -
 211
211 -
 212
212 -
 213
213 -
214
-
215
-
216
-
217
-
218
-
219
-
220
-
221
-
222
-
223
-
224
-
225
-
226
-
227
-
228
-
229
-
230
-
231
-
232
-
233
-
234
-
235
-
236
-
237
-
238
-
239
-
240
-
241
-
242
-
243
-
244
-
245
-
246
-
247
-
248
-
249
-
250
-
251
-
252
-
253
-
254
-
255
-
256
 |
 |

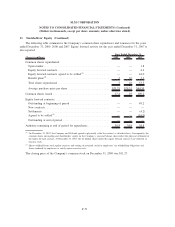
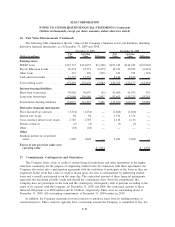
13. Stock-Based Compensation Plans and Arrangements (Continued)
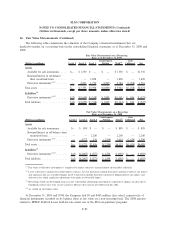
The following table summarizes restricted stock activity for the year ended December 31, 2009.
Number of
Shares
Weighted
Average Grant
Date
Fair Value
Non-vested at December 31, 2008 ............................. 754,546 $26.99
Granted ................................................. 425,400 7.92
Vested .................................................. (300,396) 28.81
Canceled ................................................ (34,970) 34.05
Non-vested at December 31, 2009 ............................. 844,580 $16.45
The total fair value of shares that vested during the years ended December 31, 2009, 2008 and 2007, was
$9 million, $11 million and $8 million, respectively.
Restricted Stock Units
Restricted stock units (“RSUs”) are stock awards granted to employees that entitle the holder to shares of
the Company’s common stock as the award vests. The fair value of each grant is determined on the grant date
based on the Company’s stock price and is amortized to compensation cost on a straight-line basis over the
related vesting periods, which are generally between one and three years based on earnings-related
performance vesting criteria being met. As of December 31, 2009, there was $.3 million of unrecognized
compensation cost related to RSUs, which is expected to be recognized over a weighted average period of
2.0 years.
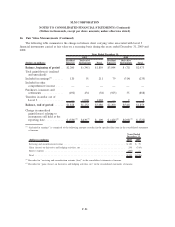
The following table summarizes RSU activity for the year ended December 31, 2009.
Number of
RSUs
Weighted
Average Grant
Date
Fair Value
Outstanding at December 31, 2008 ............................. 15,500 $11.58
Granted ................................................. 64,000 11.21
Canceled ................................................ (500) 11.21
Vested and converted to common stock.......................... (3,250) 16.22
Outstanding at December 31, 2009 ............................. 75,750 $11.07
The total fair value of RSUs that vested and converted to common stock during the year ended
December 31, 2009 was $.1 million. RSUs with a fair value of $26 million vested during the year ended
December 31, 2007 but weren’t converted to common stock until 2008.
Employee Stock Purchase Plan
Under the ESPP, employees can purchase shares of the Company’s common stock at the end of a
12-month offering period at a price equal to the share price at the beginning of the 12-month period, less
15 percent, up to a maximum purchase price of $7,500 plus accrued interest. The purchase price for each
offering is determined at the beginning of the offering period.
F-76
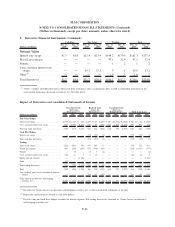
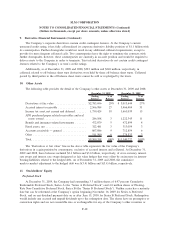
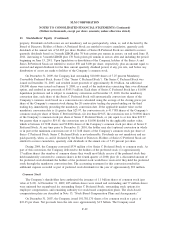
SLM CORPORATION
NOTES TO CONSOLIDATED FINANCIAL STATEMENTS (Continued)
(Dollars in thousands, except per share amounts, unless otherwise stated)