Sallie Mae 2009 Annual Report Download - page 226
Download and view the complete annual report
Please find page 226 of the 2009 Sallie Mae annual report below. You can navigate through the pages in the report by either clicking on the pages listed below, or by using the keyword search tool below to find specific information within the annual report.-
 1
1 -
2
-
3
-
4
-
5
-
6
-
7
-
8
-
9
-
10
-
11
-
12
-
13
-
14
-
15
-
16
-
17
-
18
-
19
-
20
-
21
-
22
-
23
-
24
-
25
-
26
-
27
-
28
-
29
-
30
-
31
-
32
-
33
-
34
-
35
-
36
-
37
-
38
-
39
-
40
-
41
-
42
-
43
-
44
-
45
-
46
-
47
-
48
-
49
-
50
-
51
-
52
-
53
-
54
-
55
-
56
-
57
-
58
-
59
-
60
-
61
-
62
-
63
-
64
-
65
-
66
-
67
-
68
-
69
-
70
-
71
-
72
-
73
-
74
-
75
-
76
-
77
-
78
-
79
-
80
-
81
-
82
-
83
-
84
-
85
-
86
-
87
-
88
-
89
-
90
-
91
-
92
-
93
-
94
-
95
-
96
-
97
-
98
-
99
-
100
-
101
-
102
-
103
-
104
-
105
-
106
-
107
-
108
-
109
-
110
-
111
-
112
-
113
-
114
-
115
-
116
-
117
-
118
-
119
-
120
-
121
-
122
-
123
-
124
-
125
-
126
-
127
-
128
-
129
-
130
-
131
-
132
-
133
-
134
-
135
-
136
-
137
-
138
-
139
-
140
-
141
-
142
-
143
-
144
-
145
-
146
-
147
-
148
-
149
-
150
-
151
-
152
-
153
-
154
-
155
-
156
-
157
-
158
-
159
-
160
-
161
-
162
-
163
-
164
-
165
-
166
-
167
-
168
-
169
-
170
-
171
-
172
-
173
-
174
-
175
-
176
-
177
-
178
-
179
-
180
-
181
-
182
-
183
-
184
-
185
-
186
-
187
-
188
-
189
-
190
-
191
-
192
-
193
-
194
-
195
-
196
-
197
-
198
-
199
-
200
-
201
-
202
-
203
-
204
-
205
-
206
-
207
-
208
-
209
-
210
-
211
-
212
-
213
-
214
-
215
-
 216
216 -
 217
217 -
 218
218 -
 219
219 -
 220
220 -
 221
221 -
 222
222 -
 223
223 -
 224
224 -
 225
225 -
 226
226 -
 227
227 -
 228
228 -
 229
229 -
 230
230 -
 231
231 -
 232
232 -
 233
233 -
 234
234 -
 235
235 -
 236
236 -
237
-
238
-
239
-
240
-
241
-
242
-
243
-
244
-
245
-
246
-
247
-
248
-
249
-
250
-
251
-
252
-
253
-
254
-
255
-
256
 |
 |

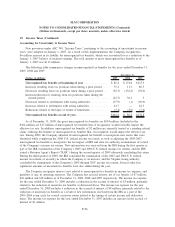
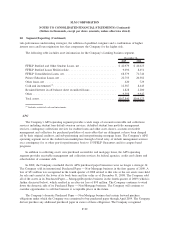
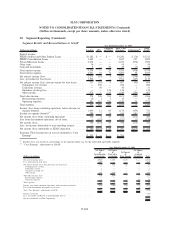
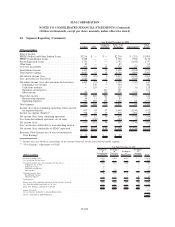
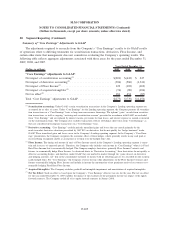
20. Segment Reporting (Continued)
risk-performance underwriting strategies, the addition of qualified cosigners and a combination of higher
interest rates and loan origination fees that compensate the Company for the higher risk.
The following table includes asset information for the Company’s Lending business segment.
2009 2008
December 31,
FFELP Stafford and Other Student Loans, net ....................... $ 42,979 $ 44,025
FFELP Stafford Loans Held-for-Sale .............................. 9,696 8,451
FFELP Consolidation Loans, net ................................. 68,379 71,744
Private Education Loans, net .................................... 22,753 20,582
Other loans, net ............................................. 420 729
Cash and investments
(1)
........................................ 12,387 8,445
Retained Interest in off-balance sheet securitized loans................. 1,828 2,200
Other ..................................................... 9,398 9,947
Total assets ................................................. $167,840 $166,123
(1)
Includes restricted cash and investments.
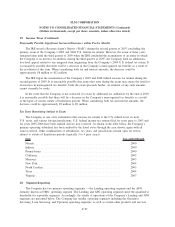
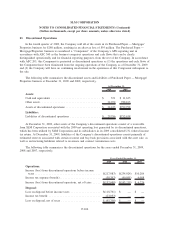
APG
The Company’s APG operating segment provides a wide range of accounts receivable and collections
services including student loan default aversion services, defaulted student loan portfolio management
services, contingency collections services for student loans and other asset classes, accounts receivable
management and collection for purchased portfolios of receivables that are delinquent or have been charged
off by their original creditors, and sub-performing and non-performing mortgage loans. The Company’s APG
operating segment serves the student loan marketplace through a broad array of default management services
on a contingency fee or other pay-for-performance basis to 15 FFELP Guarantors and for campus-based
programs.
In addition to collecting on its own purchased receivables and mortgage loans, the APG operating
segment provides receivable management and collection services for federal agencies, credit card clients and
other holders of consumer debt.
In 2008, the Company concluded that its APG purchased paper businesses were no longer a strategic fit.
The Company sold its international Purchased Paper — Non-Mortgage business in the first quarter of 2009. A
loss of $51 million was recognized in the fourth quarter of 2008 related to this sale as the net assets were held
for sale and carried at the lower of its book basis and fair value as of December 31, 2008. The Company sold
all of the assets in its Purchased Paper — Mortgage/Properties business in the fourth quarter of 2009 (which is
further discussed below), which resulted in an after-tax loss of $95 million. The Company continues to wind
down the domestic side of its Purchased Paper — Non-Mortgage business. The Company will continue to
consider opportunities to sell this business at acceptable prices in the future.
The Company’s domestic Purchased Paper — Non-Mortgage business had certain forward purchase
obligations under which the Company was committed to buy purchased paper through April 2009. The Company
did not purchase any additional purchased paper in excess of these obligations. The Company recognized
F-99
SLM CORPORATION
NOTES TO CONSOLIDATED FINANCIAL STATEMENTS (Continued)
(Dollars in thousands, except per share amounts, unless otherwise stated)