Sallie Mae 2009 Annual Report Download - page 242
Download and view the complete annual report
Please find page 242 of the 2009 Sallie Mae annual report below. You can navigate through the pages in the report by either clicking on the pages listed below, or by using the keyword search tool below to find specific information within the annual report.-
 1
1 -
2
-
3
-
4
-
5
-
6
-
7
-
8
-
9
-
10
-
11
-
12
-
13
-
14
-
15
-
16
-
17
-
18
-
19
-
20
-
21
-
22
-
23
-
24
-
25
-
26
-
27
-
28
-
29
-
30
-
31
-
32
-
33
-
34
-
35
-
36
-
37
-
38
-
39
-
40
-
41
-
42
-
43
-
44
-
45
-
46
-
47
-
48
-
49
-
50
-
51
-
52
-
53
-
54
-
55
-
56
-
57
-
58
-
59
-
60
-
61
-
62
-
63
-
64
-
65
-
66
-
67
-
68
-
69
-
70
-
71
-
72
-
73
-
74
-
75
-
76
-
77
-
78
-
79
-
80
-
81
-
82
-
83
-
84
-
85
-
86
-
87
-
88
-
89
-
90
-
91
-
92
-
93
-
94
-
95
-
96
-
97
-
98
-
99
-
100
-
101
-
102
-
103
-
104
-
105
-
106
-
107
-
108
-
109
-
110
-
111
-
112
-
113
-
114
-
115
-
116
-
117
-
118
-
119
-
120
-
121
-
122
-
123
-
124
-
125
-
126
-
127
-
128
-
129
-
130
-
131
-
132
-
133
-
134
-
135
-
136
-
137
-
138
-
139
-
140
-
141
-
142
-
143
-
144
-
145
-
146
-
147
-
148
-
149
-
150
-
151
-
152
-
153
-
154
-
155
-
156
-
157
-
158
-
159
-
160
-
161
-
162
-
163
-
164
-
165
-
166
-
167
-
168
-
169
-
170
-
171
-
172
-
173
-
174
-
175
-
176
-
177
-
178
-
179
-
180
-
181
-
182
-
183
-
184
-
185
-
186
-
187
-
188
-
189
-
190
-
191
-
192
-
193
-
194
-
195
-
196
-
197
-
198
-
199
-
200
-
201
-
202
-
203
-
204
-
205
-
206
-
207
-
208
-
209
-
210
-
211
-
212
-
213
-
214
-
215
-
216
-
217
-
218
-
219
-
220
-
221
-
222
-
223
-
224
-
225
-
226
-
227
-
228
-
229
-
230
-
231
-
 232
232 -
 233
233 -
 234
234 -
 235
235 -
 236
236 -
 237
237 -
 238
238 -
 239
239 -
 240
240 -
 241
241 -
 242
242 -
 243
243 -
 244
244 -
 245
245 -
 246
246 -
 247
247 -
 248
248 -
 249
249 -
 250
250 -
 251
251 -
 252
252 -
253
-
254
-
255
-
256
 |
 |

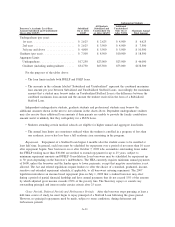
applicant (and parents in the case of a dependent child) must undergo a financial need analysis. This requires
the applicant (and parents in the case of a dependent child) to submit financial data to a federal processor. The
federal processor evaluates the parents’ and student’s financial condition under federal guidelines and
calculates the amount that the student and the family are expected to contribute towards the student’s cost of
education. After receiving information on the family contribution, the institution then subtracts the family
contribution from the student’s estimated costs of attending to determine the student’s need for financial aid.
Some of this need may be met by grants, scholarships, institutional loans and work assistance. A student’s
“unmet need” is further reduced by the amount of loans for which the borrower is eligible.
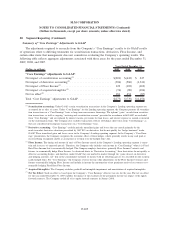
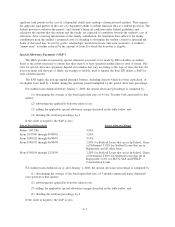
Special Allowance Payments (“SAP”)
The HEA provides for quarterly special allowance payments to be made by ED to holders of student
loans to the extent necessary to ensure that they receive at least specified market interest rates of return. The
rates for special allowance payments depend on formulas that vary according to the type of loan, the date the
loan was made and the type of funds, tax-exempt or taxable, used to finance the loan. ED makes a SAP for
each calendar quarter.
The SAP equals the average unpaid principal balance, including interest which has been capitalized, of
all eligible loans held by a holder during the quarterly period multiplied by the special allowance percentage.
For student loans disbursed before January 1, 2000, the special allowance percentage is computed by:
(1) determining the average of the bond equivalent rates of 91-day Treasury bills auctioned for that
quarter;
(2) subtracting the applicable borrower interest rate;
(3) adding the applicable special allowance margin described in the table below; and
(4) dividing the resultant percentage by 4.
If the result is negative, the SAP is zero.
Date of First Disbursement Special Allowance Margin
Before 10/17/86 ............................ 3.50%
From 10/17/86 through 09/30/92 ................ 3.25%
From 10/01/92 through 06/30/95 ................ 3.10%
From 07/01/95 through 06/30/98 ................ 2.50% for Stafford Loans that are in In-School, Grace
or Deferment 3.10% for Stafford Loans that are in
Repayment and all other loans
From 07/01/98 through 12/31/99 ................ 2.20% for Stafford Loans that are in In-School, Grace
or Deferment 2.80% for Stafford Loans that are in
Repayment 3.10% for PLUS, SLS and FFELP
Consolidation Loans
For student loans disbursed on or after January 1, 2000, the special allowance percentage is computed by:
(1) determining the average of the bond equivalent rates of 3-month commercial paper (financial)
rates quoted for that quarter;
(2) subtracting the applicable borrower interest rate;
(3) adding the applicable special allowance margin described in the table below; and
(4) dividing the resultant percentage by 4.
If the result is negative, the SAP is zero.
A-7