Sallie Mae 2009 Annual Report Download - page 106
Download and view the complete annual report
Please find page 106 of the 2009 Sallie Mae annual report below. You can navigate through the pages in the report by either clicking on the pages listed below, or by using the keyword search tool below to find specific information within the annual report.-
 1
1 -
2
-
3
-
4
-
5
-
6
-
7
-
8
-
9
-
10
-
11
-
12
-
13
-
14
-
15
-
16
-
17
-
18
-
19
-
20
-
21
-
22
-
23
-
24
-
25
-
26
-
27
-
28
-
29
-
30
-
31
-
32
-
33
-
34
-
35
-
36
-
37
-
38
-
39
-
40
-
41
-
42
-
43
-
44
-
45
-
46
-
47
-
48
-
49
-
50
-
51
-
52
-
53
-
54
-
55
-
56
-
57
-
58
-
59
-
60
-
61
-
62
-
63
-
64
-
65
-
66
-
67
-
68
-
69
-
70
-
71
-
72
-
73
-
74
-
75
-
76
-
77
-
78
-
79
-
80
-
81
-
82
-
83
-
84
-
85
-
86
-
87
-
88
-
89
-
90
-
91
-
92
-
93
-
94
-
95
-
 96
96 -
 97
97 -
 98
98 -
 99
99 -
 100
100 -
 101
101 -
 102
102 -
 103
103 -
 104
104 -
 105
105 -
 106
106 -
 107
107 -
 108
108 -
 109
109 -
 110
110 -
 111
111 -
 112
112 -
 113
113 -
 114
114 -
 115
115 -
 116
116 -
117
-
118
-
119
-
120
-
121
-
122
-
123
-
124
-
125
-
126
-
127
-
128
-
129
-
130
-
131
-
132
-
133
-
134
-
135
-
136
-
137
-
138
-
139
-
140
-
141
-
142
-
143
-
144
-
145
-
146
-
147
-
148
-
149
-
150
-
151
-
152
-
153
-
154
-
155
-
156
-
157
-
158
-
159
-
160
-
161
-
162
-
163
-
164
-
165
-
166
-
167
-
168
-
169
-
170
-
171
-
172
-
173
-
174
-
175
-
176
-
177
-
178
-
179
-
180
-
181
-
182
-
183
-
184
-
185
-
186
-
187
-
188
-
189
-
190
-
191
-
192
-
193
-
194
-
195
-
196
-
197
-
198
-
199
-
200
-
201
-
202
-
203
-
204
-
205
-
206
-
207
-
208
-
209
-
210
-
211
-
212
-
213
-
214
-
215
-
216
-
217
-
218
-
219
-
220
-
221
-
222
-
223
-
224
-
225
-
226
-
227
-
228
-
229
-
230
-
231
-
232
-
233
-
234
-
235
-
236
-
237
-
238
-
239
-
240
-
241
-
242
-
243
-
244
-
245
-
246
-
247
-
248
-
249
-
250
-
251
-
252
-
253
-
254
-
255
-
256
 |
 |

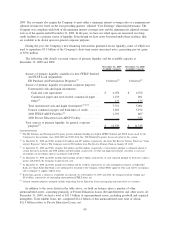
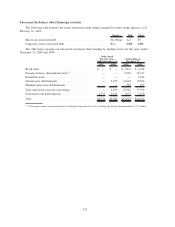
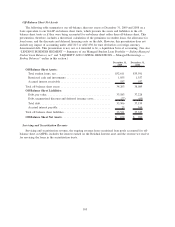
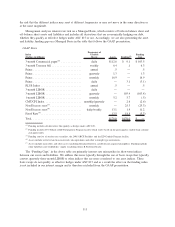
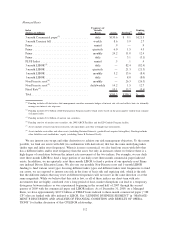
Off-Balance Sheet Net Assets
The following table summarizes our off-balance sheet net assets at December 31, 2009 and 2008 on a
basis equivalent to our GAAP on-balance sheet trusts, which presents the assets and liabilities in the off-
balance sheet trusts as if they were being accounted for on-balance sheet rather than off-balance sheet. This
presentation, therefore, includes a theoretical calculation of the premiums on student loans, the allowance for
loan losses, and the discounts and deferred financing costs on the debt. However, this presentation does not
include any impact of accounting under ASC 815 or ASC 830 for trust derivatives or foreign currency
denominated debt. This presentation is not, nor is it intended to be, a liquidation basis of accounting. (See also
“LENDING BUSINESS SEGMENT — Summary of our Managed Student Loan Portfolio — Ending Managed
Student Loan Balances, net” and “LIQUIDITY AND CAPITAL RESOURCES — Managed Borrowings —
Ending Balances” earlier in this section.)
December 31,
2009
December 31,
2008
Off-Balance Sheet Assets:
Total student loans, net ................................... $32,611 $35,591
Restricted cash and investments ............................ 1,055 1,557
Accrued interest receivable ................................ 537 937
Total off-balance sheet assets ................................ 34,203 38,085
Off-Balance Sheet Liabilities:
Debt, par value ......................................... 33,583 37,228
Debt, unamortized discount and deferred issuance costs ........... (77) (69)
Total debt............................................. 33,506 37,159
Accrued interest payable .................................. 25 166
Total off-balance sheet liabilities.............................. 33,531 37,325
Off-Balance Sheet Net Assets ............................... $ 672 $ 760
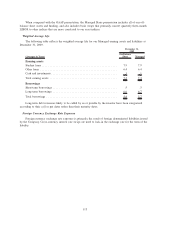
Servicing and Securitization Revenue
Servicing and securitization revenue, the ongoing revenue from securitized loan pools accounted for off-
balance sheet as QSPEs, includes the interest earned on the Residual Interest asset and the revenue we receive
for servicing the loans in the securitization trusts.
105