Sallie Mae 2009 Annual Report Download - page 53
Download and view the complete annual report
Please find page 53 of the 2009 Sallie Mae annual report below. You can navigate through the pages in the report by either clicking on the pages listed below, or by using the keyword search tool below to find specific information within the annual report.-
 1
1 -
2
-
3
-
4
-
5
-
6
-
7
-
8
-
9
-
10
-
11
-
12
-
13
-
14
-
15
-
16
-
17
-
18
-
19
-
20
-
21
-
22
-
23
-
24
-
25
-
26
-
27
-
28
-
29
-
30
-
31
-
32
-
33
-
34
-
35
-
36
-
37
-
38
-
39
-
40
-
41
-
42
-
 43
43 -
 44
44 -
 45
45 -
 46
46 -
 47
47 -
 48
48 -
 49
49 -
 50
50 -
 51
51 -
 52
52 -
 53
53 -
 54
54 -
 55
55 -
 56
56 -
 57
57 -
 58
58 -
 59
59 -
 60
60 -
 61
61 -
 62
62 -
 63
63 -
64
-
65
-
66
-
67
-
68
-
69
-
70
-
71
-
72
-
73
-
74
-
75
-
76
-
77
-
78
-
79
-
80
-
81
-
82
-
83
-
84
-
85
-
86
-
87
-
88
-
89
-
90
-
91
-
92
-
93
-
94
-
95
-
96
-
97
-
98
-
99
-
100
-
101
-
102
-
103
-
104
-
105
-
106
-
107
-
108
-
109
-
110
-
111
-
112
-
113
-
114
-
115
-
116
-
117
-
118
-
119
-
120
-
121
-
122
-
123
-
124
-
125
-
126
-
127
-
128
-
129
-
130
-
131
-
132
-
133
-
134
-
135
-
136
-
137
-
138
-
139
-
140
-
141
-
142
-
143
-
144
-
145
-
146
-
147
-
148
-
149
-
150
-
151
-
152
-
153
-
154
-
155
-
156
-
157
-
158
-
159
-
160
-
161
-
162
-
163
-
164
-
165
-
166
-
167
-
168
-
169
-
170
-
171
-
172
-
173
-
174
-
175
-
176
-
177
-
178
-
179
-
180
-
181
-
182
-
183
-
184
-
185
-
186
-
187
-
188
-
189
-
190
-
191
-
192
-
193
-
194
-
195
-
196
-
197
-
198
-
199
-
200
-
201
-
202
-
203
-
204
-
205
-
206
-
207
-
208
-
209
-
210
-
211
-
212
-
213
-
214
-
215
-
216
-
217
-
218
-
219
-
220
-
221
-
222
-
223
-
224
-
225
-
226
-
227
-
228
-
229
-
230
-
231
-
232
-
233
-
234
-
235
-
236
-
237
-
238
-
239
-
240
-
241
-
242
-
243
-
244
-
245
-
246
-
247
-
248
-
249
-
250
-
251
-
252
-
253
-
254
-
255
-
256
 |
 |

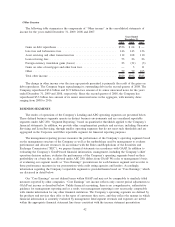
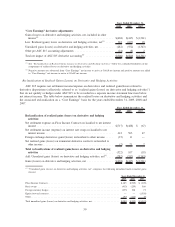
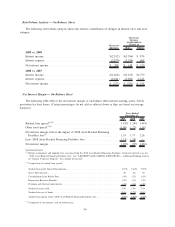
4) Acquired Intangibles: Our “Core Earnings” exclude goodwill and intangible impairment and the
amortization of acquired intangibles. The following table summarizes the goodwill and acquired intangible
adjustments for the years ended December 31, 2009, 2008 and 2007.
2009 2008 2007
Years Ended December 31,
“Core Earnings” goodwill and acquired intangibles adjustments:
Goodwill and intangible impairment and the amortization of acquired
intangibles from continuing operations .......................... $(75) $(86) $ (98)
Goodwill and intangible impairment and the amortization of acquired
intangibles from discontinued operations, net of tax ................ (1) (3) (8)
Total “Core Earnings” acquired intangibles adjustments ............... $(76) $(89) $(106)
(1)
Negative amounts are subtracted from “Core Earnings” net income to arrive at GAAP net income and positive amounts are added
to “Core Earnings” net income to arrive at GAAP net income.
Our “Core Earnings” exclude goodwill and intangible impairment and the amortization of acquired
intangibles. These amounts totaled $76 million, $89 million and $106 million after tax effecting the amounts
related to discontinued operations. The pre-tax amounts totaled $76 million, $91 million and $112 million,
respectively, for the years ended December 31, 2009, 2008 and 2007. In 2009, $37 million of intangible assets
primarily related to Guarantor Servicing were impaired as a result of the legislative uncertainty surrounding
the role of Guarantors in the future. As discussed in “ASSET PERFORMANCE GROUP BUSINESS
SEGMENT,” the Company decided to wind down its purchased paper businesses. This decision resulted in
$36 million of impairment of intangible assets for the year ended December 31, 2008, of which $28 million
related to the impairment of two trade names and $8 million related to certain banking customer relationships.
In 2007, we recognized impairments related principally to our mortgage origination and mortgage purchased
paper businesses, including approximately $20 million of goodwill and $10 million of value attributable to
certain banking relationships. In connection with our acquisition of Southwest Student Services Corporation
and Washington Transferee Corporation, we acquired certain tax exempt bonds that enabled us to earn a
9.5 percent SAP rate on student loans funded by those bonds in indentured trusts. In 2007, we also recognized
intangible impairments of $9 million, due to changes in projected interest rates used to initially value the
intangible asset and to a regulatory change that restricts the loans on which we are entitled to earn a
9.5 percent yield.
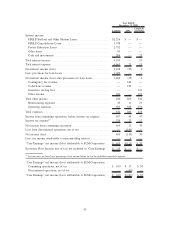
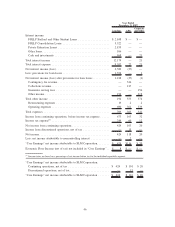
LENDING BUSINESS SEGMENT
In our Lending business segment, we originate and acquire federally guaranteed student loans and Private
Education Loans, which are not federally guaranteed. Typically, a Private Education Loan is made in
conjunction with a FFELP Stafford Loan and as a result is marketed through the same marketing channels as
FFELP loans. While FFELP loans and Private Education Loans have different overall risk profiles due to the
federal guarantee of the FFELP loans, they currently share many of the same characteristics such as similar
repayment terms, the same marketing channel and sales force, and are originated and serviced on the same
servicing platform. Finally, where possible, the borrower receives a single bill for both FFELP and Private
Education Loans.
On a Managed Basis, the Company had $107.2 billion and $127.2 billion as of December 31, 2009 and
2008, respectively, of FFELP loans indexed to three-month financial commercial paper rate (“CP”) funded
with debt indexed to LIBOR. As a result of the turmoil in the capital markets, the historically tight spread
between CP and LIBOR began to widen dramatically in the fourth quarter of 2008. It subsequently reverted to
more normal levels beginning in the third quarter of 2009 and has been stable since then.
For the fourth quarter of 2008, ED announced that for purposes of calculating the FFELP loan index from
October 27, 2008 to the end of the fourth quarter of 2008, the Federal Reserve’s Commercial Paper Funding
Facility rates (“CPFF”) would be used for those days in which no published CP rate was available. This
resulted in a CP/LIBOR spread of 21 basis points in the fourth quarter of 2008. The CP/LIBOR spread would
52