Sallie Mae 2009 Annual Report Download - page 235
Download and view the complete annual report
Please find page 235 of the 2009 Sallie Mae annual report below. You can navigate through the pages in the report by either clicking on the pages listed below, or by using the keyword search tool below to find specific information within the annual report.-
 1
1 -
 2
2 -
 3
3 -
 4
4 -
 5
5 -
 6
6 -
 7
7 -
 8
8 -
 9
9 -
 10
10 -
 11
11 -
 12
12 -
 13
13 -
 14
14 -
 15
15 -
 16
16 -
 17
17 -
 18
18 -
 19
19 -
 20
20 -
 21
21 -
 22
22 -
 23
23 -
 24
24 -
 25
25 -
 26
26 -
 27
27 -
 28
28 -
 29
29 -
 30
30 -
 31
31 -
 32
32 -
 33
33 -
 34
34 -
 35
35 -
 36
36 -
 37
37 -
 38
38 -
 39
39 -
 40
40 -
 41
41 -
 42
42 -
 43
43 -
 44
44 -
 45
45 -
 46
46 -
 47
47 -
 48
48 -
 49
49 -
 50
50 -
 51
51 -
 52
52 -
 53
53 -
 54
54 -
 55
55 -
 56
56 -
 57
57 -
 58
58 -
 59
59 -
 60
60 -
 61
61 -
 62
62 -
 63
63 -
 64
64 -
 65
65 -
 66
66 -
 67
67 -
 68
68 -
 69
69 -
 70
70 -
 71
71 -
 72
72 -
 73
73 -
 74
74 -
 75
75 -
 76
76 -
 77
77 -
 78
78 -
 79
79 -
 80
80 -
 81
81 -
 82
82 -
 83
83 -
 84
84 -
 85
85 -
 86
86 -
 87
87 -
 88
88 -
 89
89 -
 90
90 -
 91
91 -
 92
92 -
 93
93 -
 94
94 -
 95
95 -
 96
96 -
 97
97 -
 98
98 -
 99
99 -
 100
100 -
 101
101 -
 102
102 -
 103
103 -
 104
104 -
 105
105 -
 106
106 -
 107
107 -
 108
108 -
 109
109 -
 110
110 -
 111
111 -
 112
112 -
 113
113 -
 114
114 -
 115
115 -
 116
116 -
 117
117 -
 118
118 -
 119
119 -
 120
120 -
 121
121 -
 122
122 -
 123
123 -
 124
124 -
 125
125 -
 126
126 -
 127
127 -
 128
128 -
 129
129 -
 130
130 -
 131
131 -
 132
132 -
 133
133 -
 134
134 -
 135
135 -
 136
136 -
 137
137 -
 138
138 -
 139
139 -
 140
140 -
 141
141 -
 142
142 -
 143
143 -
 144
144 -
 145
145 -
 146
146 -
 147
147 -
 148
148 -
 149
149 -
 150
150 -
 151
151 -
 152
152 -
 153
153 -
 154
154 -
 155
155 -
 156
156 -
 157
157 -
 158
158 -
 159
159 -
 160
160 -
 161
161 -
 162
162 -
 163
163 -
 164
164 -
 165
165 -
 166
166 -
 167
167 -
 168
168 -
 169
169 -
 170
170 -
 171
171 -
 172
172 -
 173
173 -
 174
174 -
 175
175 -
 176
176 -
 177
177 -
 178
178 -
 179
179 -
 180
180 -
 181
181 -
 182
182 -
 183
183 -
 184
184 -
 185
185 -
 186
186 -
 187
187 -
 188
188 -
 189
189 -
 190
190 -
 191
191 -
 192
192 -
 193
193 -
 194
194 -
 195
195 -
 196
196 -
 197
197 -
 198
198 -
 199
199 -
 200
200 -
 201
201 -
 202
202 -
 203
203 -
 204
204 -
 205
205 -
 206
206 -
 207
207 -
 208
208 -
 209
209 -
 210
210 -
 211
211 -
 212
212 -
 213
213 -
 214
214 -
 215
215 -
 216
216 -
 217
217 -
 218
218 -
 219
219 -
 220
220 -
 221
221 -
 222
222 -
 223
223 -
 224
224 -
 225
225 -
 226
226 -
 227
227 -
 228
228 -
 229
229 -
 230
230 -
 231
231 -
 232
232 -
 233
233 -
 234
234 -
 235
235 -
 236
236 -
 237
237 -
 238
238 -
 239
239 -
 240
240 -
 241
241 -
 242
242 -
 243
243 -
 244
244 -
 245
245 -
 246
246 -
 247
247 -
 248
248 -
 249
249 -
 250
250 -
 251
251 -
 252
252 -
 253
253 -
 254
254 -
 255
255 -
 256
256
 |
 |

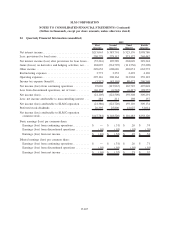
22. Quarterly Financial Information (unaudited) (Continued)
First
Quarter
Second
Quarter
Third
Quarter
Fourth
Quarter
2008
Net interest income ............................. $276,369 $402,543 $ 474,749 $ 210,559
Less: provisions for loan losses .................... 137,311 143,015 186,909 252,415
Net interest income (loss) after provisions for loan
losses ..................................... 139,058 259,528 287,840 (41,856)
Gains (losses) on derivative and hedging activities, net . . . (272,796) 362,043 (241,757) (292,903)
Other income ................................. 338,859 230,390 199,895 287,922
Restructuring expenses........................... 20,520 46,740 10,508 5,748
Operating expenses ............................. 346,046 344,302 353,739 270,864
Income tax expense (benefit) . . .................... (60,725) 167,519 (51,301) (132,263)
Net income (loss) from continuing operations .......... (100,720) 293,400 (66,968) (191,186)
Loss from discontinued operations, net of taxes ........ (3,149) (24,738) (91,029) (24,304)
Net income (loss) .............................. (103,869) 268,662 (157,997) (215,490)
Less: net income attributable to noncontrolling interest . . . (65) 2,926 544 527
Net income (loss) attributable to SLM Corporation ...... (103,804) 265,736 (158,541) (216,017)
Preferred stock dividends ......................... 29,025 27,391 27,474 27,316
Net income (loss) attributable to SLM Corporation
common stock ............................... $(132,829) $238,345 $(186,015) $(243,333)
Basic earnings (loss) per common share:
Earnings (loss) from continuing operations .......... $ (.27) $ .56 $ (.20) $ (.47)
Earnings (loss) from discontinued operations ........ (.01) (.05) (.20) (.05)
Earnings (loss) from net income .................. $ (.28) $ .51 $ (.40) $ (.52)
Diluted earnings (loss) per common share:
Earnings (loss) from continuing operations .......... $ (.27) $ .55 $ (.20) $ (.47)
Earnings (loss) from discontinued operations ........ (.01) (.05) (.20) (.05)
Earnings (loss) from net income .................. $ (.28) $ .50 $ (.40) $ (.52)
F-108
SLM CORPORATION
NOTES TO CONSOLIDATED FINANCIAL STATEMENTS (Continued)
(Dollars in thousands, except per share amounts, unless otherwise stated)
