Sallie Mae 2009 Annual Report Download - page 20
Download and view the complete annual report
Please find page 20 of the 2009 Sallie Mae annual report below. You can navigate through the pages in the report by either clicking on the pages listed below, or by using the keyword search tool below to find specific information within the annual report.-
 1
1 -
2
-
3
-
4
-
5
-
6
-
7
-
8
-
9
-
 10
10 -
 11
11 -
 12
12 -
 13
13 -
 14
14 -
 15
15 -
 16
16 -
 17
17 -
 18
18 -
 19
19 -
 20
20 -
 21
21 -
 22
22 -
 23
23 -
 24
24 -
 25
25 -
 26
26 -
 27
27 -
 28
28 -
 29
29 -
 30
30 -
31
-
32
-
33
-
34
-
35
-
36
-
37
-
38
-
39
-
40
-
41
-
42
-
43
-
44
-
45
-
46
-
47
-
48
-
49
-
50
-
51
-
52
-
53
-
54
-
55
-
56
-
57
-
58
-
59
-
60
-
61
-
62
-
63
-
64
-
65
-
66
-
67
-
68
-
69
-
70
-
71
-
72
-
73
-
74
-
75
-
76
-
77
-
78
-
79
-
80
-
81
-
82
-
83
-
84
-
85
-
86
-
87
-
88
-
89
-
90
-
91
-
92
-
93
-
94
-
95
-
96
-
97
-
98
-
99
-
100
-
101
-
102
-
103
-
104
-
105
-
106
-
107
-
108
-
109
-
110
-
111
-
112
-
113
-
114
-
115
-
116
-
117
-
118
-
119
-
120
-
121
-
122
-
123
-
124
-
125
-
126
-
127
-
128
-
129
-
130
-
131
-
132
-
133
-
134
-
135
-
136
-
137
-
138
-
139
-
140
-
141
-
142
-
143
-
144
-
145
-
146
-
147
-
148
-
149
-
150
-
151
-
152
-
153
-
154
-
155
-
156
-
157
-
158
-
159
-
160
-
161
-
162
-
163
-
164
-
165
-
166
-
167
-
168
-
169
-
170
-
171
-
172
-
173
-
174
-
175
-
176
-
177
-
178
-
179
-
180
-
181
-
182
-
183
-
184
-
185
-
186
-
187
-
188
-
189
-
190
-
191
-
192
-
193
-
194
-
195
-
196
-
197
-
198
-
199
-
200
-
201
-
202
-
203
-
204
-
205
-
206
-
207
-
208
-
209
-
210
-
211
-
212
-
213
-
214
-
215
-
216
-
217
-
218
-
219
-
220
-
221
-
222
-
223
-
224
-
225
-
226
-
227
-
228
-
229
-
230
-
231
-
232
-
233
-
234
-
235
-
236
-
237
-
238
-
239
-
240
-
241
-
242
-
243
-
244
-
245
-
246
-
247
-
248
-
249
-
250
-
251
-
252
-
253
-
254
-
255
-
256
 |
 |

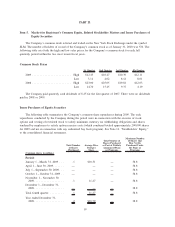
PART II.
Item 5. Market for Registrant’s Common Equity, Related Stockholder Matters and Issuer Purchases of
Equity Securities
The Company’s common stock is listed and traded on the New York Stock Exchange under the symbol
SLM. The number of holders of record of the Company’s common stock as of January 31, 2010 was 536. The
following table sets forth the high and low sales prices for the Company’s common stock for each full
quarterly period within the two most recent fiscal years.
Common Stock Prices
1st Quarter 2nd Quarter 3rd Quarter 4th Quarter
2009 ......................... High $12.43 $10.47 $10.39 $12.11
Low 3.11 4.02 8.12 8.01
2008 ......................... High $23.00 $25.05 $19.81 $12.03
Low 14.70 15.45 9.37 4.19
The Company paid quarterly cash dividends of $.25 for the first quarter of 2007. There were no dividends
paid in 2008 or 2009.
Issuer Purchases of Equity Securities
The following table summarizes the Company’s common share repurchases during 2009. The only
repurchases conducted by the Company during the period were in connection with the exercise of stock
options and vesting of restricted stock to satisfy minimum statutory tax withholding obligations and shares
tendered by employees to satisfy option exercise costs (which combined totaled approximately 200,000 shares
for 2009 and not in connection with any authorized buy back program). See Note 11, “Stockholders’ Equity,”
to the consolidated financial statements.
Total Number
of Shares
Purchased
Average Price
Paid per
Share
Total Number of
Shares Purchased
as Part of Publicly
Announced Plans
or Programs
Maximum Number
of Shares that
May Yet Be
Purchased Under
the Plans or
Programs
(Common shares in millions)
Period:
January 1 – March 31, 2009 . . . .1 $10.31 — 38.8
April 1 – June 30, 2009....... — — — 38.8
July 1 – September 30, 2009 . . . — — — 38.8
October 1 – October 31, 2009 . . — — — 38.8
November 1 – November 30,
2009 ................... .1 11.27 — 38.8
December 1 – December 31,
2009 ................... — — — 38.8
Total fourth quarter .......... .1 11.27 — 38.8
Year ended December 31,
2009 ................... .2 $10.79 — 38.8
19