Sallie Mae 2009 Annual Report Download - page 37
Download and view the complete annual report
Please find page 37 of the 2009 Sallie Mae annual report below. You can navigate through the pages in the report by either clicking on the pages listed below, or by using the keyword search tool below to find specific information within the annual report.-
 1
1 -
2
-
3
-
4
-
5
-
6
-
7
-
8
-
9
-
10
-
11
-
12
-
13
-
14
-
15
-
16
-
17
-
18
-
19
-
20
-
21
-
22
-
23
-
24
-
25
-
26
-
 27
27 -
 28
28 -
 29
29 -
 30
30 -
 31
31 -
 32
32 -
 33
33 -
 34
34 -
 35
35 -
 36
36 -
 37
37 -
 38
38 -
 39
39 -
 40
40 -
 41
41 -
 42
42 -
 43
43 -
 44
44 -
 45
45 -
 46
46 -
 47
47 -
48
-
49
-
50
-
51
-
52
-
53
-
54
-
55
-
56
-
57
-
58
-
59
-
60
-
61
-
62
-
63
-
64
-
65
-
66
-
67
-
68
-
69
-
70
-
71
-
72
-
73
-
74
-
75
-
76
-
77
-
78
-
79
-
80
-
81
-
82
-
83
-
84
-
85
-
86
-
87
-
88
-
89
-
90
-
91
-
92
-
93
-
94
-
95
-
96
-
97
-
98
-
99
-
100
-
101
-
102
-
103
-
104
-
105
-
106
-
107
-
108
-
109
-
110
-
111
-
112
-
113
-
114
-
115
-
116
-
117
-
118
-
119
-
120
-
121
-
122
-
123
-
124
-
125
-
126
-
127
-
128
-
129
-
130
-
131
-
132
-
133
-
134
-
135
-
136
-
137
-
138
-
139
-
140
-
141
-
142
-
143
-
144
-
145
-
146
-
147
-
148
-
149
-
150
-
151
-
152
-
153
-
154
-
155
-
156
-
157
-
158
-
159
-
160
-
161
-
162
-
163
-
164
-
165
-
166
-
167
-
168
-
169
-
170
-
171
-
172
-
173
-
174
-
175
-
176
-
177
-
178
-
179
-
180
-
181
-
182
-
183
-
184
-
185
-
186
-
187
-
188
-
189
-
190
-
191
-
192
-
193
-
194
-
195
-
196
-
197
-
198
-
199
-
200
-
201
-
202
-
203
-
204
-
205
-
206
-
207
-
208
-
209
-
210
-
211
-
212
-
213
-
214
-
215
-
216
-
217
-
218
-
219
-
220
-
221
-
222
-
223
-
224
-
225
-
226
-
227
-
228
-
229
-
230
-
231
-
232
-
233
-
234
-
235
-
236
-
237
-
238
-
239
-
240
-
241
-
242
-
243
-
244
-
245
-
246
-
247
-
248
-
249
-
250
-
251
-
252
-
253
-
254
-
255
-
256
 |
 |

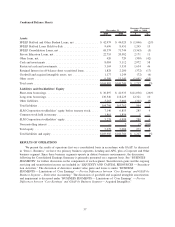
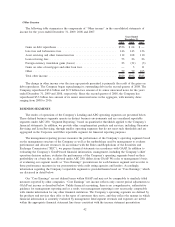
SELECTED FINANCIAL DATA
Condensed Statements of Income
2009 2008 2007 $ % $ %
Years Ended December 31, 2009 vs. 2008 2008 vs. 2007
Increase (Decrease)
Net interest income. . . . . . . . . . . . . . . . . . . . . . . . . $1,723 $1,365 $ 1,588 $ 358 26% $(223) (14)%
Less: provisions for loan losses . . . . . . . . . . . . . . . . 1,119 720 1,015 399 55 (295) (29)
Net interest income after provisions for loan losses . . 604 645 573 (41) (6) 72 13
Gains on student loan securitizations . . . . . . . . . . . . — — 367 — — (367) (100)
Servicing and securitization revenue . . . . . . . . . . . . . 295 262 437 33 13 (175) (40)
Gains (losses) on loans and securities, net . . . . . . . . . 284 (186) (95) 470 253 (91) (96)
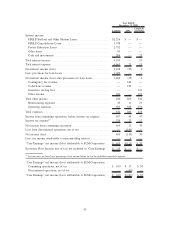
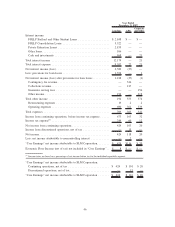
Gains (losses) on derivative and hedging activities,
net. . . . . . . . . . . . . . . . . . . . . . . . . . . . . . . . . . . (604) (445) (1,361) (159) (36) 916 67
Contingency fee revenue . . . . . . . . . . . . . . . . . . . . . 296 340 336 (44) (13) 4 1
Collections revenue . . . . . . . . . . . . . . . . . . . . . . . . 51 128 220 (77) (60) (92) (42)
Guarantor servicing fees . . . . . . . . . . . . . . . . . . . . . 136 121 156 15 12 (35) (22)
Other income . . . . . . . . . . . . . . . . . . . . . . . . . . . . . 928 392 385 536 137 7 2
Restructuring expenses . . . . . . . . . . . . . . . . . . . . . . 14 83 23 (69) (83) 60 261
Operating expenses . . . . . . . . . . . . . . . . . . . . . . . . . 1,255 1,316 1,487 (61) (5) (171) (11)
Income (loss) from continuing operations, before
income tax expense (benefit) . . . . . . . . . . . . . . . . 721 (142) (492) 863 (608) 350 71
Income tax expense (benefit) . . . . . . . . . . . . . . . . . . 238 (76) 408 314 (413) (484) (119)
Net income (loss) from continuing operations . . . . . . 483 (66) (900) 549 832 834 93
(Loss) income from discontinued operations, net of
tax. . . . . . . . . . . . . . . . . . . . . . . . . . . . . . . . . . . (158) (143) 6 (15) (10) (149) (2483)
Net income (loss) . . . . . . . . . . . . . . . . . . . . . . . . . . 325 (209) (894) 534 256 685 77
Less: net income attributable to noncontrolling
interest. . . . . . . . . . . . . . . . . . . . . . . . . . . . . . . . 1 4 2 (3) (75) 2 100
Net income (loss) attributable to SLM
Corporation . . . . . . . . . . . . . . . . . . . . . . . . . . . 324 (213) (896) 537 252 683 76
Preferred stock dividends . . . . . . . . . . . . . . . . . . . . 146 111 37 35 32 74 200
Net income (loss) attributable to common stock. . . . . $ 178 $ (324) $ (933) $ 502 155% $ 609 65%
Net income (loss) attributable to SLM Corporation:
Continuing operations, net of tax . . . . . . . . . . . . . $ 482 $ (70) $ (902) $ 552 789% $ 832 92%
Discontinued operations, net of tax . . . . . . . . . . . . (158) (143) 6 (15) (10) (149) (2483)
Net income (loss) attributable to SLM Corporation . . $ 324 $ (213) $ (896) $ 537 252% $ 683 76%
Basic earnings (loss) per common share:
Continuing operations . . . . . . . . . . . . . . . . . . . . . $ .71 $ (.39) $ (2.28) $1.10 282% $1.89 83%
Discontinued operations. . . . . . . . . . . . . . . . . . . . $ (.33) $ (.30) $ .02 $ (.03) (10)% $ (.32) 1600%
Total . . . . . . . . . . . . . . . . . . . . . . . . . . . . . . . . . . . $ .38 $ (.69) $ (2.26) $1.07 155% $1.57 69%
Diluted earnings (loss) per common share:
Continuing operations . . . . . . . . . . . . . . . . . . . . . $ .71 $ (.39) $ (2.28) $1.10 282% $1.89 83%
Discontinued operations. . . . . . . . . . . . . . . . . . . . $ (.33) $ (.30) $ .02 $ (.03) (10)% $ (.32) 1600%
Total . . . . . . . . . . . . . . . . . . . . . . . . . . . . . . . . . . . $ .38 $ (.69) $ (2.26) $1.07 155% $1.57 69%
Dividends per common share . . . . . . . . . . . . . . . . . . $ — $ — $ .25 $ — —% $ (.25) (100)%
36