Sallie Mae 2009 Annual Report Download - page 112
Download and view the complete annual report
Please find page 112 of the 2009 Sallie Mae annual report below. You can navigate through the pages in the report by either clicking on the pages listed below, or by using the keyword search tool below to find specific information within the annual report.-
 1
1 -
2
-
3
-
4
-
5
-
6
-
7
-
8
-
9
-
10
-
11
-
12
-
13
-
14
-
15
-
16
-
17
-
18
-
19
-
20
-
21
-
22
-
23
-
24
-
25
-
26
-
27
-
28
-
29
-
30
-
31
-
32
-
33
-
34
-
35
-
36
-
37
-
38
-
39
-
40
-
41
-
42
-
43
-
44
-
45
-
46
-
47
-
48
-
49
-
50
-
51
-
52
-
53
-
54
-
55
-
56
-
57
-
58
-
59
-
60
-
61
-
62
-
63
-
64
-
65
-
66
-
67
-
68
-
69
-
70
-
71
-
72
-
73
-
74
-
75
-
76
-
77
-
78
-
79
-
80
-
81
-
82
-
83
-
84
-
85
-
86
-
87
-
88
-
89
-
90
-
91
-
92
-
93
-
94
-
95
-
96
-
97
-
98
-
99
-
100
-
101
-
 102
102 -
 103
103 -
 104
104 -
 105
105 -
 106
106 -
 107
107 -
 108
108 -
 109
109 -
 110
110 -
 111
111 -
 112
112 -
 113
113 -
 114
114 -
 115
115 -
 116
116 -
 117
117 -
 118
118 -
 119
119 -
 120
120 -
 121
121 -
 122
122 -
123
-
124
-
125
-
126
-
127
-
128
-
129
-
130
-
131
-
132
-
133
-
134
-
135
-
136
-
137
-
138
-
139
-
140
-
141
-
142
-
143
-
144
-
145
-
146
-
147
-
148
-
149
-
150
-
151
-
152
-
153
-
154
-
155
-
156
-
157
-
158
-
159
-
160
-
161
-
162
-
163
-
164
-
165
-
166
-
167
-
168
-
169
-
170
-
171
-
172
-
173
-
174
-
175
-
176
-
177
-
178
-
179
-
180
-
181
-
182
-
183
-
184
-
185
-
186
-
187
-
188
-
189
-
190
-
191
-
192
-
193
-
194
-
195
-
196
-
197
-
198
-
199
-
200
-
201
-
202
-
203
-
204
-
205
-
206
-
207
-
208
-
209
-
210
-
211
-
212
-
213
-
214
-
215
-
216
-
217
-
218
-
219
-
220
-
221
-
222
-
223
-
224
-
225
-
226
-
227
-
228
-
229
-
230
-
231
-
232
-
233
-
234
-
235
-
236
-
237
-
238
-
239
-
240
-
241
-
242
-
243
-
244
-
245
-
246
-
247
-
248
-
249
-
250
-
251
-
252
-
253
-
254
-
255
-
256
 |
 |

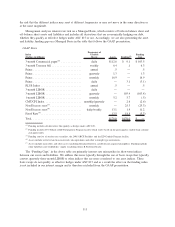
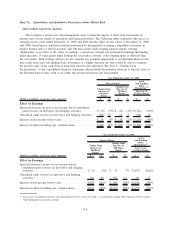
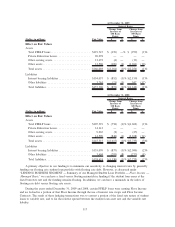
the risk that the different indices may reset at different frequencies or may not move in the same direction or
at the same magnitude.
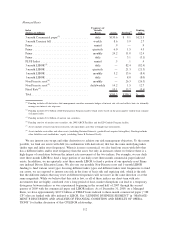
Management analyzes interest rate risk on a Managed Basis, which consists of both on-balance sheet and
off-balance sheet assets and liabilities and includes all derivatives that are economically hedging our debt,
whether they qualify as effective hedges under ASC 815 or not. Accordingly, we are also presenting the asset
and liability funding gap on a Managed Basis in the table that follows the GAAP presentation.
GAAP Basis
Index
(Dollars in billions)
Frequency of
Variable
Resets Assets Funding
(1)
Funding
Gap
3-month Commercial paper
(2)
............. daily $112.6 $ 9.1 $ 103.5
3-month Treasury bill ................... weekly 6.4 .1 6.3
Prime ............................... annual .5 — .5
Prime ............................... quarterly 1.3 — 1.3
Prime ............................... monthly 16.9 — 16.9
Prime ............................... daily — 3.1 (3.1)
PLUS Index .......................... annual .5 — .5
3-month LIBOR ....................... daily — — —
3-month LIBOR ....................... quarterly — 103.4 (103.4)
1-month LIBOR ....................... monthly 5.2 5.7 (.5)
CMT/CPI Index ....................... monthly/quarterly — 2.6 (2.6)
Non-Discrete reset
(3)
.................... monthly — 25.3 (25.3)
Non-Discrete reset
(4)
.................... daily/weekly 13.1 1.9 11.2
Fixed Rate
(5)
.......................... 13.5 18.8 (5.3)
Total................................ $170.0 $170.0 $ —
(1)
Funding includes all derivatives that qualify as hedges under ASC 815.
(2)
Funding includes $9.0 billion of ED Participation Program facility which resets based on the prior quarter student loan commer-
cial paper index.
(3)
Funding consists of auction rate securities, the 2008 ABCP Facilities and the ED Conduit Program facility.
(4)
Assets include restricted and non-restricted cash equivalents and other overnight type instruments.
(5)
Assets include receivables and other assets (including Retained Interests, goodwill and acquired intangibles). Funding includes
other liabilities and stockholders’ equity (excluding Series B Preferred Stock).
The “Funding Gaps” in the above table are primarily interest rate mismatches in short-term indices
between our assets and liabilities. We address this issue typically through the use of basis swaps that typically
convert quarterly three-month LIBOR to other indices that are more correlated to our asset indices. These
basis swaps do not qualify as effective hedges under ASC 815 and as a result the effect on the funding index
is not included in our interest margin and is therefore excluded from the GAAP presentation.
111