Sallie Mae 2009 Annual Report Download - page 93
Download and view the complete annual report
Please find page 93 of the 2009 Sallie Mae annual report below. You can navigate through the pages in the report by either clicking on the pages listed below, or by using the keyword search tool below to find specific information within the annual report.-
 1
1 -
2
-
3
-
4
-
5
-
6
-
7
-
8
-
9
-
10
-
11
-
12
-
13
-
14
-
15
-
16
-
17
-
18
-
19
-
20
-
21
-
22
-
23
-
24
-
25
-
26
-
27
-
28
-
29
-
30
-
31
-
32
-
33
-
34
-
35
-
36
-
37
-
38
-
39
-
40
-
41
-
42
-
43
-
44
-
45
-
46
-
47
-
48
-
49
-
50
-
51
-
52
-
53
-
54
-
55
-
56
-
57
-
58
-
59
-
60
-
61
-
62
-
63
-
64
-
65
-
66
-
67
-
68
-
69
-
70
-
71
-
72
-
73
-
74
-
75
-
76
-
77
-
78
-
79
-
80
-
81
-
82
-
 83
83 -
 84
84 -
 85
85 -
 86
86 -
 87
87 -
 88
88 -
 89
89 -
 90
90 -
 91
91 -
 92
92 -
 93
93 -
 94
94 -
 95
95 -
 96
96 -
 97
97 -
 98
98 -
 99
99 -
 100
100 -
 101
101 -
 102
102 -
 103
103 -
104
-
105
-
106
-
107
-
108
-
109
-
110
-
111
-
112
-
113
-
114
-
115
-
116
-
117
-
118
-
119
-
120
-
121
-
122
-
123
-
124
-
125
-
126
-
127
-
128
-
129
-
130
-
131
-
132
-
133
-
134
-
135
-
136
-
137
-
138
-
139
-
140
-
141
-
142
-
143
-
144
-
145
-
146
-
147
-
148
-
149
-
150
-
151
-
152
-
153
-
154
-
155
-
156
-
157
-
158
-
159
-
160
-
161
-
162
-
163
-
164
-
165
-
166
-
167
-
168
-
169
-
170
-
171
-
172
-
173
-
174
-
175
-
176
-
177
-
178
-
179
-
180
-
181
-
182
-
183
-
184
-
185
-
186
-
187
-
188
-
189
-
190
-
191
-
192
-
193
-
194
-
195
-
196
-
197
-
198
-
199
-
200
-
201
-
202
-
203
-
204
-
205
-
206
-
207
-
208
-
209
-
210
-
211
-
212
-
213
-
214
-
215
-
216
-
217
-
218
-
219
-
220
-
221
-
222
-
223
-
224
-
225
-
226
-
227
-
228
-
229
-
230
-
231
-
232
-
233
-
234
-
235
-
236
-
237
-
238
-
239
-
240
-
241
-
242
-
243
-
244
-
245
-
246
-
247
-
248
-
249
-
250
-
251
-
252
-
253
-
254
-
255
-
256
 |
 |

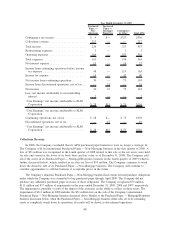
2008 versus 2007
The decrease in guarantor servicing fees from 2007 to 2008 was primarily due to the recognition of
$15 million in the fourth quarter of 2007 of previously deferred guarantee account maintenance fee revenue
related to a negotiated settlement with USA Funds, as well as a decrease in the account maintenance fees
earned in 2008 due to the legislative changes effective October 1, 2007 as a result of CCRAA.
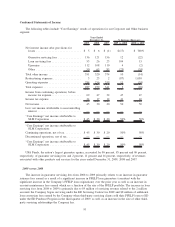
Operating Expenses — Corporate and Other Business Segment
The following table summarizes the components of operating expenses for our Corporate and Other
business segment.
2009 2008 2007
Years Ended
December 31,
Operating expenses ........................................... $110 $ 90 $109
Upromise .................................................. 84 91 94
General and administrative expenses .............................. 90 75 136
Total ...................................................... $284 $256 $339
Operating expenses for our Corporate and Other business segment include direct costs incurred to service
loans for unrelated third parties, perform guarantor servicing on behalf of Guarantor agencies and operate our
Upromise subsidiary, as well as information technology expenses related to these functions. Operating
expenses also include unallocated corporate overhead expenses for centralized headquarters functions.
2009 versus 2008
For the years ended December 31, 2009 and 2008, operating expenses for the Corporate and Other
business segment totaled $284 million and $256 million, respectively. The increase in operating expenses in
2009 versus the prior year was primarily due to higher expenses incurred to reconfigure the Company’s
servicing system to meet the requirements of the ED Servicing Contract awarded to the Company on June 17,
2009 to service FFELP loans that have been or will be sold to ED, as well as professional services fees
incurred in connection with strategic planning.
2008 versus 2007
The decrease in operating expenses in 2008 compared to 2007 was primarily due to $56 million of non-
recurring Proposed Merger-related expenses in 2007, as well as the Company’s cost reduction initiatives.
At December 31, 2009 and 2008, the Corporate and Other business segment had total assets of
$1.2 million and $685 million, respectively.
92