Sallie Mae 2009 Annual Report Download - page 168
Download and view the complete annual report
Please find page 168 of the 2009 Sallie Mae annual report below. You can navigate through the pages in the report by either clicking on the pages listed below, or by using the keyword search tool below to find specific information within the annual report.-
 1
1 -
2
-
3
-
4
-
5
-
6
-
7
-
8
-
9
-
10
-
11
-
12
-
13
-
14
-
15
-
16
-
17
-
18
-
19
-
20
-
21
-
22
-
23
-
24
-
25
-
26
-
27
-
28
-
29
-
30
-
31
-
32
-
33
-
34
-
35
-
36
-
37
-
38
-
39
-
40
-
41
-
42
-
43
-
44
-
45
-
46
-
47
-
48
-
49
-
50
-
51
-
52
-
53
-
54
-
55
-
56
-
57
-
58
-
59
-
60
-
61
-
62
-
63
-
64
-
65
-
66
-
67
-
68
-
69
-
70
-
71
-
72
-
73
-
74
-
75
-
76
-
77
-
78
-
79
-
80
-
81
-
82
-
83
-
84
-
85
-
86
-
87
-
88
-
89
-
90
-
91
-
92
-
93
-
94
-
95
-
96
-
97
-
98
-
99
-
100
-
101
-
102
-
103
-
104
-
105
-
106
-
107
-
108
-
109
-
110
-
111
-
112
-
113
-
114
-
115
-
116
-
117
-
118
-
119
-
120
-
121
-
122
-
123
-
124
-
125
-
126
-
127
-
128
-
129
-
130
-
131
-
132
-
133
-
134
-
135
-
136
-
137
-
138
-
139
-
140
-
141
-
142
-
143
-
144
-
145
-
146
-
147
-
148
-
149
-
150
-
151
-
152
-
153
-
154
-
155
-
156
-
157
-
 158
158 -
 159
159 -
 160
160 -
 161
161 -
 162
162 -
 163
163 -
 164
164 -
 165
165 -
 166
166 -
 167
167 -
 168
168 -
 169
169 -
 170
170 -
 171
171 -
 172
172 -
 173
173 -
 174
174 -
 175
175 -
 176
176 -
 177
177 -
 178
178 -
179
-
180
-
181
-
182
-
183
-
184
-
185
-
186
-
187
-
188
-
189
-
190
-
191
-
192
-
193
-
194
-
195
-
196
-
197
-
198
-
199
-
200
-
201
-
202
-
203
-
204
-
205
-
206
-
207
-
208
-
209
-
210
-
211
-
212
-
213
-
214
-
215
-
216
-
217
-
218
-
219
-
220
-
221
-
222
-
223
-
224
-
225
-
226
-
227
-
228
-
229
-
230
-
231
-
232
-
233
-
234
-
235
-
236
-
237
-
238
-
239
-
240
-
241
-
242
-
243
-
244
-
245
-
246
-
247
-
248
-
249
-
250
-
251
-
252
-
253
-
254
-
255
-
256
 |
 |

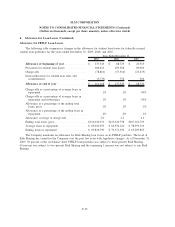
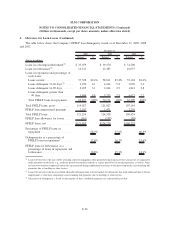
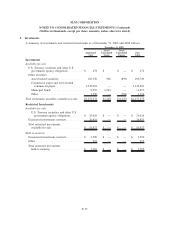
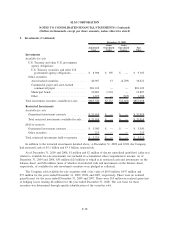
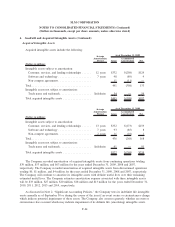
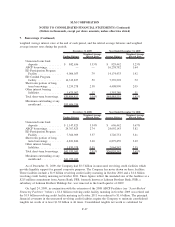
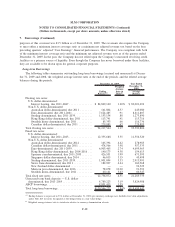
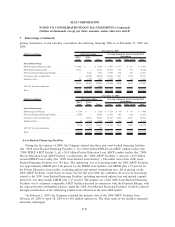
6. Goodwill and Acquired Intangible Assets (Continued)
additional cash flows for the Lending reporting unit but no material change in cash flows for the APG or
Guarantor Servicing reporting units.
Under the Company’s guidance, the appraisal firm developed both an asset rate of return and an equity
rate of return (or discount rate) for each reporting unit incorporating such factors as a risk free rate, a market
rate of return, a measure of volatility (Beta) and a company specific and capital markets risk premium, as
appropriate, to adjust for volatility and uncertainty in the economy and to capture specific risk related to the
respective reporting units. The Company considered whether an asset sale or an equity sale would be the most
likely sale structure for each reporting unit and valued each reporting unit based on the more likely
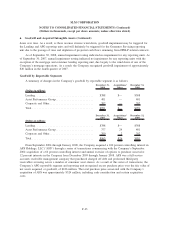
hypothetical scenario. Resulting discount rates and growth rates used as of September 30, 2009, for the
Lending, APG, Guarantor Servicing, and Upromise reporting units were:
Discount Rate Growth Rate
Lending
(1)
.............................................. 11% 3%
APG
(2)
................................................. 10% 4%
Guarantor Servicing
(2)
..................................... 10% 0%
Upromise
(2)
............................................. 15% 4%
(1)
Assumes an equity sale; therefore, the discount rate is used to value the entire reporting unit.
(2)
Assumes an asset sale; therefore, the discount rate is used to value the assets of the reporting unit.
The discount rates reflect market based estimates of capital costs and are adjusted for management’s
assessment of a market participant’s view with respect to execution, concentration and other risks associated
with the projected cash flows of individual reporting units. Accordingly, these discount rates are reflective of
the long standing contractual relationships associated with these cash flows as well as the wind down nature
of the cash flows for certain components of the Lending and APG reporting units and the Guarantor Servicing
reporting unit as a whole. Management reviewed and approved these discount rates, including the factors
incorporated to develop the discount rates for each reporting unit. For the valuation of the Lending reporting
unit, which assumed an equity sale, the discount rate was applied to the reporting unit’s projected net cash
flows and the residual or terminal value yielding the fair value of equity for the reporting unit. For valuations
assuming an asset sale, the discount rates applicable to the individual reporting units were applied to the
respective reporting units’ projected asset cash flows and residual or terminal values, as applicable, yielding
the fair value of the assets for the respective reporting units. The estimated proceeds from the hypothetical
asset sale were then used to payoff any liabilities of the reporting unit with the remaining cash equaling the
fair value of the reporting unit’s equity.
The guideline company or market approach, as well as the publicly traded stock approach, were also
considered for the Company’s reporting units, as applicable. The market approach generally measures the
value of a reporting unit as compared to recent sales or offerings of comparable companies. The secondary
market approach indicates value based on multiples calculated using the market value of minority interests in
publicly traded comparable companies or guideline companies. Whether analyzing comparable transactions or
the market value of minority interests in publicly traded guideline companies, consideration is given to the
line of business and the operating performance of the comparable companies versus the reporting unit being
tested. Given current market conditions, the lack of recent sales or offerings in the market and the low
correlation between the operations of identified guideline companies to the Company’s reporting units, less
emphasis was placed on the market approach for the APG, Guarantor Servicing and Upromise reporting units.
The Company acknowledges that its stock price (as well as that of its peers) is a consideration in
determining the value of its reporting units and the Company as a whole. However, management believes the
F-41
SLM CORPORATION
NOTES TO CONSOLIDATED FINANCIAL STATEMENTS (Continued)
(Dollars in thousands, except per share amounts, unless otherwise stated)