Sallie Mae 2009 Annual Report Download - page 107
Download and view the complete annual report
Please find page 107 of the 2009 Sallie Mae annual report below. You can navigate through the pages in the report by either clicking on the pages listed below, or by using the keyword search tool below to find specific information within the annual report.-
 1
1 -
2
-
3
-
4
-
5
-
6
-
7
-
8
-
9
-
10
-
11
-
12
-
13
-
14
-
15
-
16
-
17
-
18
-
19
-
20
-
21
-
22
-
23
-
24
-
25
-
26
-
27
-
28
-
29
-
30
-
31
-
32
-
33
-
34
-
35
-
36
-
37
-
38
-
39
-
40
-
41
-
42
-
43
-
44
-
45
-
46
-
47
-
48
-
49
-
50
-
51
-
52
-
53
-
54
-
55
-
56
-
57
-
58
-
59
-
60
-
61
-
62
-
63
-
64
-
65
-
66
-
67
-
68
-
69
-
70
-
71
-
72
-
73
-
74
-
75
-
76
-
77
-
78
-
79
-
80
-
81
-
82
-
83
-
84
-
85
-
86
-
87
-
88
-
89
-
90
-
91
-
92
-
93
-
94
-
95
-
96
-
 97
97 -
 98
98 -
 99
99 -
 100
100 -
 101
101 -
 102
102 -
 103
103 -
 104
104 -
 105
105 -
 106
106 -
 107
107 -
 108
108 -
 109
109 -
 110
110 -
 111
111 -
 112
112 -
 113
113 -
 114
114 -
 115
115 -
 116
116 -
 117
117 -
118
-
119
-
120
-
121
-
122
-
123
-
124
-
125
-
126
-
127
-
128
-
129
-
130
-
131
-
132
-
133
-
134
-
135
-
136
-
137
-
138
-
139
-
140
-
141
-
142
-
143
-
144
-
145
-
146
-
147
-
148
-
149
-
150
-
151
-
152
-
153
-
154
-
155
-
156
-
157
-
158
-
159
-
160
-
161
-
162
-
163
-
164
-
165
-
166
-
167
-
168
-
169
-
170
-
171
-
172
-
173
-
174
-
175
-
176
-
177
-
178
-
179
-
180
-
181
-
182
-
183
-
184
-
185
-
186
-
187
-
188
-
189
-
190
-
191
-
192
-
193
-
194
-
195
-
196
-
197
-
198
-
199
-
200
-
201
-
202
-
203
-
204
-
205
-
206
-
207
-
208
-
209
-
210
-
211
-
212
-
213
-
214
-
215
-
216
-
217
-
218
-
219
-
220
-
221
-
222
-
223
-
224
-
225
-
226
-
227
-
228
-
229
-
230
-
231
-
232
-
233
-
234
-
235
-
236
-
237
-
238
-
239
-
240
-
241
-
242
-
243
-
244
-
245
-
246
-
247
-
248
-
249
-
250
-
251
-
252
-
253
-
254
-
255
-
256
 |
 |

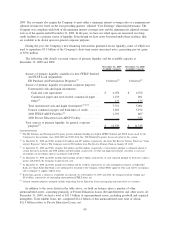
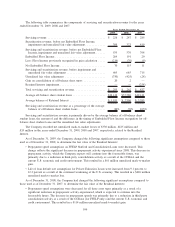
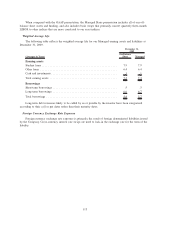
The following table summarizes the components of servicing and securitization revenue for the years
ended December 31, 2009, 2008 and 2007.
2009 2008 2007
Years Ended December 31,
Servicing revenue ..................................... $ 226 $ 247 $ 285
Securitization revenue, before net Embedded Floor Income,
impairment and unrealized fair value adjustment ............. 309 323 419
Servicing and securitization revenue, before net Embedded Floor
Income, impairment and unrealized fair value adjustment ...... 535 570 704
Embedded Floor Income ................................ 284 191 20
Less: Floor Income previously recognized in gain calculation ..... (214) (76) (9)
Net Embedded Floor Income ............................. 70 115 11
Servicing and securitization revenue, before impairment and
unrealized fair value adjustment ......................... 605 685 715
Unrealized fair value adjustment .......................... (330) (425) (24)
Gain on consolidation of off-balance sheet trusts .............. 20 2 —
Retained Interest impairment ............................. — — (254)
Total servicing and securitization revenue .................... $ 295 $ 262 $ 437
Average off-balance sheet student loans ..................... $34,414 $37,586 $42,411
Average balance of Retained Interest ....................... $ 1,911 $ 2,596 $ 3,385
Servicing and securitization revenue as a percentage of the average
balance of off-balance sheet student loans .................. .86% .70% 1.03%
Servicing and securitization revenue is primarily driven by the average balance of off-balance sheet
student loans, the amount of and the difference in the timing of Embedded Floor Income recognition for off-
balance sheet student loans and the unrealized fair value adjustments.
The Company recorded net unrealized mark-to-market losses of $330 million, $425 million and
$24 million in the years ended December 31, 2009, 2008 and 2007, respectively, related to the Residual
Interest.
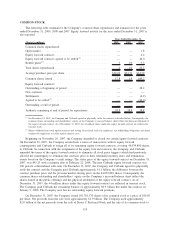
As of December 31, 2009, the Company changed the following significant assumptions compared to those
used as of December 31, 2008, to determine the fair value of the Residual Interests:
• Prepayment speed assumptions on FFELP Stafford and Consolidation Loans were decreased. This
change reflects the significant decrease in prepayment activity experienced since 2008. This decrease in
prepayment activity, which the Company expects will continue into the foreseeable future, was
primarily due to a reduction in third-party consolidation activity as a result of the CCRAA and the
current U.S. economic and credit environment. This resulted in a $61 million unrealized mark-to-market
gain.
• Life of loan default rate assumptions for Private Education Loans were increased from 9.1 percent to
12.2 percent as a result of the continued weakening of the U.S. economy. This resulted in a $426 million
unrealized mark-to-market loss.
As of December 31, 2008, the Company had changed the following significant assumptions compared to
those used as of December 31, 2007, to determine the fair value of the Residual Interests:
• Prepayment speed assumptions were decreased for all three asset types primarily as a result of a
significant reduction in prepayment activity experienced, which is expected to continue into the
foreseeable future. The decrease in prepayment speeds was primarily due to a reduction in third-party
consolidation activity as a result of the CCRAA (for FFELP only) and the current U.S. economic and
credit environment. This resulted in a $114 million unrealized mark-to-market gain.
106