Sallie Mae 2009 Annual Report Download - page 39
Download and view the complete annual report
Please find page 39 of the 2009 Sallie Mae annual report below. You can navigate through the pages in the report by either clicking on the pages listed below, or by using the keyword search tool below to find specific information within the annual report.-
 1
1 -
2
-
3
-
4
-
5
-
6
-
7
-
8
-
9
-
10
-
11
-
12
-
13
-
14
-
15
-
16
-
17
-
18
-
19
-
20
-
21
-
22
-
23
-
24
-
25
-
26
-
27
-
28
-
 29
29 -
 30
30 -
 31
31 -
 32
32 -
 33
33 -
 34
34 -
 35
35 -
 36
36 -
 37
37 -
 38
38 -
 39
39 -
 40
40 -
 41
41 -
 42
42 -
 43
43 -
 44
44 -
 45
45 -
 46
46 -
 47
47 -
 48
48 -
 49
49 -
50
-
51
-
52
-
53
-
54
-
55
-
56
-
57
-
58
-
59
-
60
-
61
-
62
-
63
-
64
-
65
-
66
-
67
-
68
-
69
-
70
-
71
-
72
-
73
-
74
-
75
-
76
-
77
-
78
-
79
-
80
-
81
-
82
-
83
-
84
-
85
-
86
-
87
-
88
-
89
-
90
-
91
-
92
-
93
-
94
-
95
-
96
-
97
-
98
-
99
-
100
-
101
-
102
-
103
-
104
-
105
-
106
-
107
-
108
-
109
-
110
-
111
-
112
-
113
-
114
-
115
-
116
-
117
-
118
-
119
-
120
-
121
-
122
-
123
-
124
-
125
-
126
-
127
-
128
-
129
-
130
-
131
-
132
-
133
-
134
-
135
-
136
-
137
-
138
-
139
-
140
-
141
-
142
-
143
-
144
-
145
-
146
-
147
-
148
-
149
-
150
-
151
-
152
-
153
-
154
-
155
-
156
-
157
-
158
-
159
-
160
-
161
-
162
-
163
-
164
-
165
-
166
-
167
-
168
-
169
-
170
-
171
-
172
-
173
-
174
-
175
-
176
-
177
-
178
-
179
-
180
-
181
-
182
-
183
-
184
-
185
-
186
-
187
-
188
-
189
-
190
-
191
-
192
-
193
-
194
-
195
-
196
-
197
-
198
-
199
-
200
-
201
-
202
-
203
-
204
-
205
-
206
-
207
-
208
-
209
-
210
-
211
-
212
-
213
-
214
-
215
-
216
-
217
-
218
-
219
-
220
-
221
-
222
-
223
-
224
-
225
-
226
-
227
-
228
-
229
-
230
-
231
-
232
-
233
-
234
-
235
-
236
-
237
-
238
-
239
-
240
-
241
-
242
-
243
-
244
-
245
-
246
-
247
-
248
-
249
-
250
-
251
-
252
-
253
-
254
-
255
-
256
 |
 |
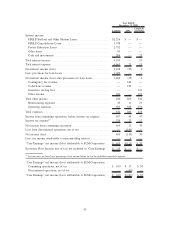
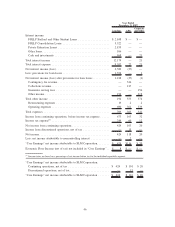
CONSOLIDATED EARNINGS SUMMARY
The main drivers of our net income are the growth in our Managed student loan portfolio and our
financing cost, which drives net interest income, gains and losses on the sales of student loans, gains on debt
repurchases, unrealized gains and losses on derivatives that do not receive hedge accounting treatment, growth
in our fee-based business, and expense control.
Year Ended December 31, 2009 Compared to Year Ended December 31, 2008
For the year ended December 31, 2009, net income attributable to SLM Corporation was $324 million, or
$.38 diluted earnings per common share attributable to SLM Corporation common shareholders, compared to a
net loss of $213 million, or $.69 diluted loss per common share attributable to SLM Corporation common
shareholders, for the year ended December 31, 2008. For the year ended December 31, 2009, net income
attributable to SLM Corporation from continuing operations was $482 million, or $.71 diluted earnings from
continuing operations per common share attributable to SLM Corporation common shareholders, compared to
a net loss from continuing operations of $70 million, or $.39 diluted loss from continuing operations per
common share attributable to SLM Corporation common shareholders, for year ended December 31, 2008. For
the year ended December 31, 2009, net loss attributable to SLM Corporation from discontinued operations
was $158 million or $.33 diluted loss from discontinued operations per common share attributable to SLM
Corporation common shareholders, compared to a net loss from discontinued operations of $143 million, or
$.30 diluted loss from discontinued operations per common share attributable to SLM Corporation common
shareholders, for the year ended December 31, 2008.
For the year ended December 31, 2009, the Company’s pre-tax income from continuing operations was
$721 million compared to a pre-tax loss of $142 million in the prior year. The increase in pre-tax income of
$863 million was primarily due to an increase in gains on debt repurchases of $472 million and an increase in
gains on sales of loans and securities of $470 million offset by an increase of $159 million in net losses on
derivative and hedging activities. The change in the net losses on derivative and hedging activities is primarily
the result of mark-to-market derivative valuations on derivatives that do not qualify for “hedge treatment”
under GAAP.
There were no gains on student loan securitizations in either the year ended December 31, 2009 or the
prior year as the Company did not complete any off-balance sheet securitizations in those years. Servicing and
securitization revenue increased by $33 million from $262 million in the year ended December 31, 2008 to
$295 million in the year ended December 31, 2009. This increase was primarily due to a $95 million decrease
in the current-year unrealized mark-to-market loss of $330 million on the Company’s Residual Interests
compared with the prior-year unrealized mark-to-market loss of $425 million, offset by the decrease in net
Embedded Floor Income. See “LIQUIDITY AND CAPITAL RESOURCES — Securitization Activities —
Retained Interest in Securitized Receivables” for further discussion of the factors impacting the fair values.
Net interest income after provisions for loan losses decreased by $41 million in the year ended
December 31, 2009 from the prior year. This decrease was due to a $399 million increase in provisions for
loan losses offset by a $358 million increase in net interest income. The increase in net interest income was
primarily due to an increase in the student loan spread, a decrease in the 2008 Asset Backed Financing
Facilities fees and a $15 billion increase in the average balance of on-balance sheet student loans (see
“LENDING BUSINESS SEGMENT — Net Interest Income — Net Interest Margin — On-Balance Sheet”).
The increase in provisions for loan losses related primarily to increases in charge-off expectations on Private
Education Loans primarily as a result of the continued weakening of the U.S. economy (see “LENDING
BUSINESS SEGMENT — Private Education Loan Losses — Private Education Loan Delinquencies and
Forbearance” and “— Allowance for Private Education Loan Losses”).
There were $284 million in net gains on sales of loans and securities in the year ended December 31,
2009, primarily related to the ED Purchase Program as previously discussed, compared to net losses of
$186 million incurred in the prior year. Prior to the fourth quarter of 2008, these losses were primarily the
result of the Company’s repurchase of delinquent Private Education Loans from the Company’s off-balance
sheet securitization trusts. When Private Education Loans in the Company’s off-balance sheet securitization
38