Sallie Mae 2009 Annual Report Download - page 175
Download and view the complete annual report
Please find page 175 of the 2009 Sallie Mae annual report below. You can navigate through the pages in the report by either clicking on the pages listed below, or by using the keyword search tool below to find specific information within the annual report.-
 1
1 -
2
-
3
-
4
-
5
-
6
-
7
-
8
-
9
-
10
-
11
-
12
-
13
-
14
-
15
-
16
-
17
-
18
-
19
-
20
-
21
-
22
-
23
-
24
-
25
-
26
-
27
-
28
-
29
-
30
-
31
-
32
-
33
-
34
-
35
-
36
-
37
-
38
-
39
-
40
-
41
-
42
-
43
-
44
-
45
-
46
-
47
-
48
-
49
-
50
-
51
-
52
-
53
-
54
-
55
-
56
-
57
-
58
-
59
-
60
-
61
-
62
-
63
-
64
-
65
-
66
-
67
-
68
-
69
-
70
-
71
-
72
-
73
-
74
-
75
-
76
-
77
-
78
-
79
-
80
-
81
-
82
-
83
-
84
-
85
-
86
-
87
-
88
-
89
-
90
-
91
-
92
-
93
-
94
-
95
-
96
-
97
-
98
-
99
-
100
-
101
-
102
-
103
-
104
-
105
-
106
-
107
-
108
-
109
-
110
-
111
-
112
-
113
-
114
-
115
-
116
-
117
-
118
-
119
-
120
-
121
-
122
-
123
-
124
-
125
-
126
-
127
-
128
-
129
-
130
-
131
-
132
-
133
-
134
-
135
-
136
-
137
-
138
-
139
-
140
-
141
-
142
-
143
-
144
-
145
-
146
-
147
-
148
-
149
-
150
-
151
-
152
-
153
-
154
-
155
-
156
-
157
-
158
-
159
-
160
-
161
-
162
-
163
-
164
-
 165
165 -
 166
166 -
 167
167 -
 168
168 -
 169
169 -
 170
170 -
 171
171 -
 172
172 -
 173
173 -
 174
174 -
 175
175 -
 176
176 -
 177
177 -
 178
178 -
 179
179 -
 180
180 -
 181
181 -
 182
182 -
 183
183 -
 184
184 -
 185
185 -
186
-
187
-
188
-
189
-
190
-
191
-
192
-
193
-
194
-
195
-
196
-
197
-
198
-
199
-
200
-
201
-
202
-
203
-
204
-
205
-
206
-
207
-
208
-
209
-
210
-
211
-
212
-
213
-
214
-
215
-
216
-
217
-
218
-
219
-
220
-
221
-
222
-
223
-
224
-
225
-
226
-
227
-
228
-
229
-
230
-
231
-
232
-
233
-
234
-
235
-
236
-
237
-
238
-
239
-
240
-
241
-
242
-
243
-
244
-
245
-
246
-
247
-
248
-
249
-
250
-
251
-
252
-
253
-
254
-
255
-
256
 |
 |

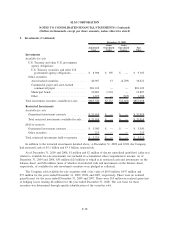
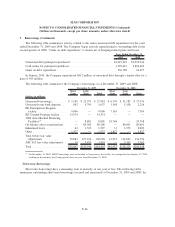
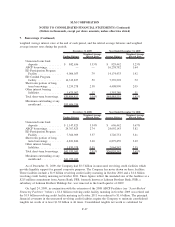
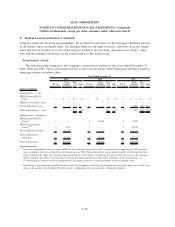
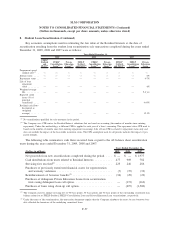
7. Borrowings (Continued)
purposes of this covenant was $3.5 billion as of December 31, 2009. The covenants also require the Company
to meet either a minimum interest coverage ratio or a minimum net adjusted revenue test based on the four
preceding quarters’ adjusted “Core Earnings” financial performance. The Company was compliant with both
of the minimum interest coverage ratio and the minimum net adjusted revenue tests as of the quarter ended
December 31, 2009. In the past, the Company has not relied upon the Company’s unsecured revolving credit
facilities as a primary source of liquidity. Even though the Company has never borrowed under these facilities,
they are available to be drawn upon for general corporate purposes.
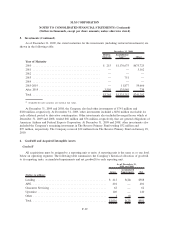
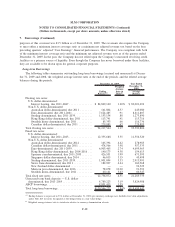
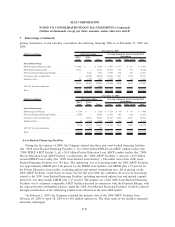
Long-term Borrowings
The following tables summarize outstanding long-term borrowings (secured and unsecured) at Decem-
ber 31, 2009 and 2008, the weighted average interest rates at the end of the periods, and the related average
balances during the periods.
Ending
Balance
(1)
Weighted
Average
Interest
Rate
(2)
Average
Balance
Year Ended
December 31,
2009
December 31, 2009
Floating rate notes:
U.S. dollar-denominated:
Interest bearing, due 2011-2047 ............... $ 84,849,160 1.20% $ 83,001,692
Non-U.S. dollar-denominated:
Australian dollar-denominated, due 2011 ........ 161,804 4.57 443,080
Euro-denominated, due 2011-2041 ............. 7,624,485 .91 8,411,807
Sterling-denominated, due 2011-2039 ........... 1,153,134 .88 1,273,890
Hong Kong dollar-denominated, due 2011 ....... 113,741 .41 113,716
Swedish krona-denominated, due 2011 .......... 85,353 .66 116,736
Canadian dollar-denominated, due 2011 ......... 229,885 .67 229,885
Total floating rate notes ........................ 94,217,562 1.17 93,590,806
Fixed rate notes:
U.S. dollar-denominated:
Interest bearing, due 2011-2043 ............... 12,355,688 5.55 11,556,520
Non-U.S.-dollar denominated:
Australian dollar-denominated, due 2012 ........ 165,394 4.42 278,983
Canadian dollar-denominated, due 2011 ......... 478,566 3.98 557,333
Euro-denominated, due 2011-2039 ............. 6,903,465 2.74 4,695,963
Hong Kong dollar-denominated, due 2014-2016 . . . 140,173 4.38 154,613
Japanese yen-denominated, due 2011-2035 ....... 426,551 1.99 671,595
Singapore dollar-denominated, due 2014 ........ 46,015 3.15 45,498
Sterling-denominated, due 2011-2039 ........... 1,901,094 5.33 2,913,991
Swiss franc-denominated, due 2011 ............ 182,907 2.24 160,568
New Zealand dollar-denominated .............. — — 96,529
Mexican peso-denominated, due 2016 .......... 78,078 10.30 91,593
Swedish krona-denominated, due 2011 .......... 60,141 3.63 60,547
Total fixed rate notes .......................... 22,738,072 4.51 21,283,733
Unsecured term bank deposits — U.S. dollar-
denominated, due 2011-2019 ................... 4,789,223 3.19 3,824,908
ABCP borrowings ............................. 8,801,415 1.55 —
Total long-term borrowings . . .................... $130,546,272 1.84% $118,699,447
(1)
Ending balance is expressed in U.S. dollars at December 31, 2009 spot currency exchange rate. Includes fair value adjustments
under ASC 815 for notes designated as the hedged item in a fair value hedge.
(2)
Weighted average interest rate is stated rate relative to currency denomination of note.
F-48
SLM CORPORATION
NOTES TO CONSOLIDATED FINANCIAL STATEMENTS (Continued)
(Dollars in thousands, except per share amounts, unless otherwise stated)