Sallie Mae 2009 Annual Report Download - page 66
Download and view the complete annual report
Please find page 66 of the 2009 Sallie Mae annual report below. You can navigate through the pages in the report by either clicking on the pages listed below, or by using the keyword search tool below to find specific information within the annual report.-
 1
1 -
 2
2 -
 3
3 -
 4
4 -
 5
5 -
 6
6 -
 7
7 -
 8
8 -
 9
9 -
 10
10 -
 11
11 -
 12
12 -
 13
13 -
 14
14 -
 15
15 -
 16
16 -
 17
17 -
 18
18 -
 19
19 -
 20
20 -
 21
21 -
 22
22 -
 23
23 -
 24
24 -
 25
25 -
 26
26 -
 27
27 -
 28
28 -
 29
29 -
 30
30 -
 31
31 -
 32
32 -
 33
33 -
 34
34 -
 35
35 -
 36
36 -
 37
37 -
 38
38 -
 39
39 -
 40
40 -
 41
41 -
 42
42 -
 43
43 -
 44
44 -
 45
45 -
 46
46 -
 47
47 -
 48
48 -
 49
49 -
 50
50 -
 51
51 -
 52
52 -
 53
53 -
 54
54 -
 55
55 -
 56
56 -
 57
57 -
 58
58 -
 59
59 -
 60
60 -
 61
61 -
 62
62 -
 63
63 -
 64
64 -
 65
65 -
 66
66 -
 67
67 -
 68
68 -
 69
69 -
 70
70 -
 71
71 -
 72
72 -
 73
73 -
 74
74 -
 75
75 -
 76
76 -
 77
77 -
 78
78 -
 79
79 -
 80
80 -
 81
81 -
 82
82 -
 83
83 -
 84
84 -
 85
85 -
 86
86 -
 87
87 -
 88
88 -
 89
89 -
 90
90 -
 91
91 -
 92
92 -
 93
93 -
 94
94 -
 95
95 -
 96
96 -
 97
97 -
 98
98 -
 99
99 -
 100
100 -
 101
101 -
 102
102 -
 103
103 -
 104
104 -
 105
105 -
 106
106 -
 107
107 -
 108
108 -
 109
109 -
 110
110 -
 111
111 -
 112
112 -
 113
113 -
 114
114 -
 115
115 -
 116
116 -
 117
117 -
 118
118 -
 119
119 -
 120
120 -
 121
121 -
 122
122 -
 123
123 -
 124
124 -
 125
125 -
 126
126 -
 127
127 -
 128
128 -
 129
129 -
 130
130 -
 131
131 -
 132
132 -
 133
133 -
 134
134 -
 135
135 -
 136
136 -
 137
137 -
 138
138 -
 139
139 -
 140
140 -
 141
141 -
 142
142 -
 143
143 -
 144
144 -
 145
145 -
 146
146 -
 147
147 -
 148
148 -
 149
149 -
 150
150 -
 151
151 -
 152
152 -
 153
153 -
 154
154 -
 155
155 -
 156
156 -
 157
157 -
 158
158 -
 159
159 -
 160
160 -
 161
161 -
 162
162 -
 163
163 -
 164
164 -
 165
165 -
 166
166 -
 167
167 -
 168
168 -
 169
169 -
 170
170 -
 171
171 -
 172
172 -
 173
173 -
 174
174 -
 175
175 -
 176
176 -
 177
177 -
 178
178 -
 179
179 -
 180
180 -
 181
181 -
 182
182 -
 183
183 -
 184
184 -
 185
185 -
 186
186 -
 187
187 -
 188
188 -
 189
189 -
 190
190 -
 191
191 -
 192
192 -
 193
193 -
 194
194 -
 195
195 -
 196
196 -
 197
197 -
 198
198 -
 199
199 -
 200
200 -
 201
201 -
 202
202 -
 203
203 -
 204
204 -
 205
205 -
 206
206 -
 207
207 -
 208
208 -
 209
209 -
 210
210 -
 211
211 -
 212
212 -
 213
213 -
 214
214 -
 215
215 -
 216
216 -
 217
217 -
 218
218 -
 219
219 -
 220
220 -
 221
221 -
 222
222 -
 223
223 -
 224
224 -
 225
225 -
 226
226 -
 227
227 -
 228
228 -
 229
229 -
 230
230 -
 231
231 -
 232
232 -
 233
233 -
 234
234 -
 235
235 -
 236
236 -
 237
237 -
 238
238 -
 239
239 -
 240
240 -
 241
241 -
 242
242 -
 243
243 -
 244
244 -
 245
245 -
 246
246 -
 247
247 -
 248
248 -
 249
249 -
 250
250 -
 251
251 -
 252
252 -
 253
253 -
 254
254 -
 255
255 -
 256
256
 |
 |

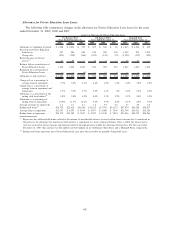
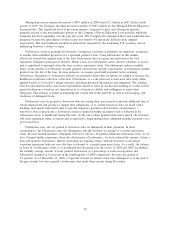
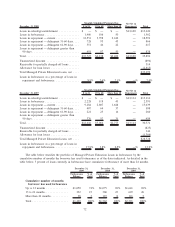
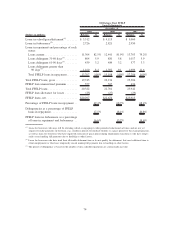
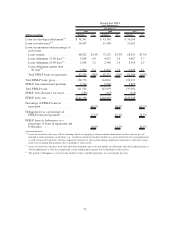
When measured as a percentage of ending loans in repayment, the off-balance sheet allowance for loan
losses percentage is lower than the on-balance sheet percentage because of the different mix and aging of
loans on-balance sheet and off-balance sheet.
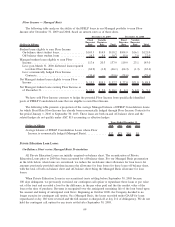
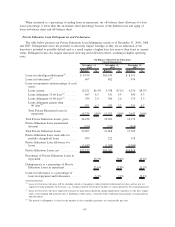
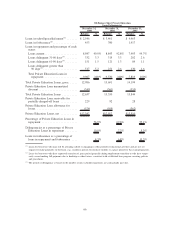
Private Education Loan Delinquencies and Forbearance
The table below presents our Private Education Loan delinquency trends as of December 31, 2009, 2008
and 2007. Delinquencies have the potential to adversely impact earnings as they are an indication of the
borrower’s potential to possibly default and as a result require a higher loan loss reserve than loans in current
status. Delinquent loans also require increased servicing and collection efforts, resulting in higher operating
costs.
Balance % Balance % Balance %
December 31,
2009
December 31,
2008
December 31,
2007
On-Balance Sheet Private Education
Loan Delinquencies
Loans in-school/grace/deferment
(1)
....... $ 8,910 $10,159 $ 8,151
Loans in forbearance
(2)
................ 967 862 974
Loans in repayment and percentage of each
status:
Loans current ..................... 12,421 86.4% 9,748 87.2% 6,236 88.5%
Loans delinquent 31-60 days
(3)
........ 647 4.5 551 4.9 306 4.3
Loans delinquent 61-90 days
(3)
........ 340 2.4 296 2.6 176 2.5
Loans delinquent greater than
90 days
(3)
...................... 971 6.7 587 5.3 329 4.7
Total Private Education Loans in
repayment...................... 14,379 100% 11,182 100% 7,047 100%
Total Private Education Loans, gross...... 24,256 22,203 16,172
Private Education Loan unamortized
discount ......................... (559) (535) (468)
Total Private Education Loans .......... 23,697 21,668 15,704
Private Education Loan receivable for
partially charged-off loans ........... 499 222 118
Private Education Loan allowance for
losses ........................... (1,443) (1,308) (1,004)
Private Education Loans, net ........... $22,753 $20,582 $14,818
Percentage of Private Education Loans in
repayment ....................... 59.3% 50.4% 43.6%
Delinquencies as a percentage of Private
Education Loans in repayment ........ 13.6% 12.8% 11.5%
Loans in forbearance as a percentage of
loans in repayment and forbearance .... 6.3% 7.2% 12.1%
(1)
Loans for borrowers who may still be attending school or engaging in other permitted educational activities and are not yet
required to make payments on the loans, e.g., residency periods for medical students or a grace period for bar exam preparation.
(2)
Loans for borrowers who have requested extension of grace period generally during employment transition or who have tempo-
rarily ceased making full payments due to hardship or other factors, consistent with established loan program servicing policies
and procedures.
(3)
The period of delinquency is based on the number of days scheduled payments are contractually past due.
65
