Sallie Mae 2009 Annual Report Download - page 72
Download and view the complete annual report
Please find page 72 of the 2009 Sallie Mae annual report below. You can navigate through the pages in the report by either clicking on the pages listed below, or by using the keyword search tool below to find specific information within the annual report.-
 1
1 -
2
-
3
-
4
-
5
-
6
-
7
-
8
-
9
-
10
-
11
-
12
-
13
-
14
-
15
-
16
-
17
-
18
-
19
-
20
-
21
-
22
-
23
-
24
-
25
-
26
-
27
-
28
-
29
-
30
-
31
-
32
-
33
-
34
-
35
-
36
-
37
-
38
-
39
-
40
-
41
-
42
-
43
-
44
-
45
-
46
-
47
-
48
-
49
-
50
-
51
-
52
-
53
-
54
-
55
-
56
-
57
-
58
-
59
-
60
-
61
-
 62
62 -
 63
63 -
 64
64 -
 65
65 -
 66
66 -
 67
67 -
 68
68 -
 69
69 -
 70
70 -
 71
71 -
 72
72 -
 73
73 -
 74
74 -
 75
75 -
 76
76 -
 77
77 -
 78
78 -
 79
79 -
 80
80 -
 81
81 -
 82
82 -
83
-
84
-
85
-
86
-
87
-
88
-
89
-
90
-
91
-
92
-
93
-
94
-
95
-
96
-
97
-
98
-
99
-
100
-
101
-
102
-
103
-
104
-
105
-
106
-
107
-
108
-
109
-
110
-
111
-
112
-
113
-
114
-
115
-
116
-
117
-
118
-
119
-
120
-
121
-
122
-
123
-
124
-
125
-
126
-
127
-
128
-
129
-
130
-
131
-
132
-
133
-
134
-
135
-
136
-
137
-
138
-
139
-
140
-
141
-
142
-
143
-
144
-
145
-
146
-
147
-
148
-
149
-
150
-
151
-
152
-
153
-
154
-
155
-
156
-
157
-
158
-
159
-
160
-
161
-
162
-
163
-
164
-
165
-
166
-
167
-
168
-
169
-
170
-
171
-
172
-
173
-
174
-
175
-
176
-
177
-
178
-
179
-
180
-
181
-
182
-
183
-
184
-
185
-
186
-
187
-
188
-
189
-
190
-
191
-
192
-
193
-
194
-
195
-
196
-
197
-
198
-
199
-
200
-
201
-
202
-
203
-
204
-
205
-
206
-
207
-
208
-
209
-
210
-
211
-
212
-
213
-
214
-
215
-
216
-
217
-
218
-
219
-
220
-
221
-
222
-
223
-
224
-
225
-
226
-
227
-
228
-
229
-
230
-
231
-
232
-
233
-
234
-
235
-
236
-
237
-
238
-
239
-
240
-
241
-
242
-
243
-
244
-
245
-
246
-
247
-
248
-
249
-
250
-
251
-
252
-
253
-
254
-
255
-
256
 |
 |
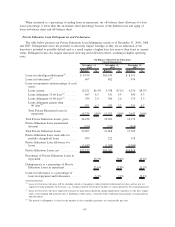
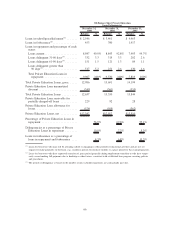
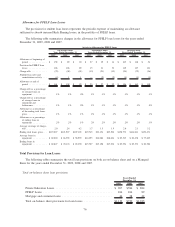
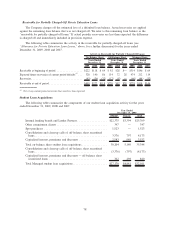
The table below reflects the historical effectiveness of using forbearance. Our experience has shown that
three years after being granted forbearance for the first time, over 70 percent of the loans are current,
paid-in-full or receiving an in-school grace or deferment, and 14 percent have defaulted. The default
experience associated with loans which utilize forbearance is considered in our allowance for loan losses.
Status distribution
36 months after
being granted
forbearance
for the first time
Status distribution
36 months after
entering repayment
(all loans)
Status distribution
36 months after
entering repayment for
loans never entering
forbearance
Tracking by First Time in Forbearance Compared to All Loans Entering Repayment
In-school/grace/deferment .......... 8.4% 8.2% 3.2%
Current ........................ 52.2 57.9 63.9
Delinquent 31-60 days ............. 3.2 2.0 .4
Delinquent 61-90 days ............. 1.9 1.1 .2
Delinquent greater than 90 days ...... 4.1 2.4 .3
Forbearance ..................... 6.0 4.1 —
Defaulted ...................... 14.3 7.5 4.9
Paid .......................... 9.9 16.8 27.1
Total .......................... 100% 100% 100%
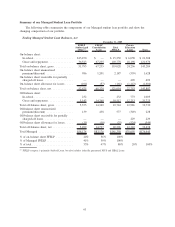
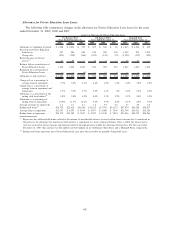
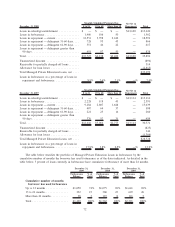
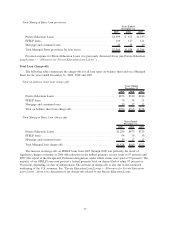
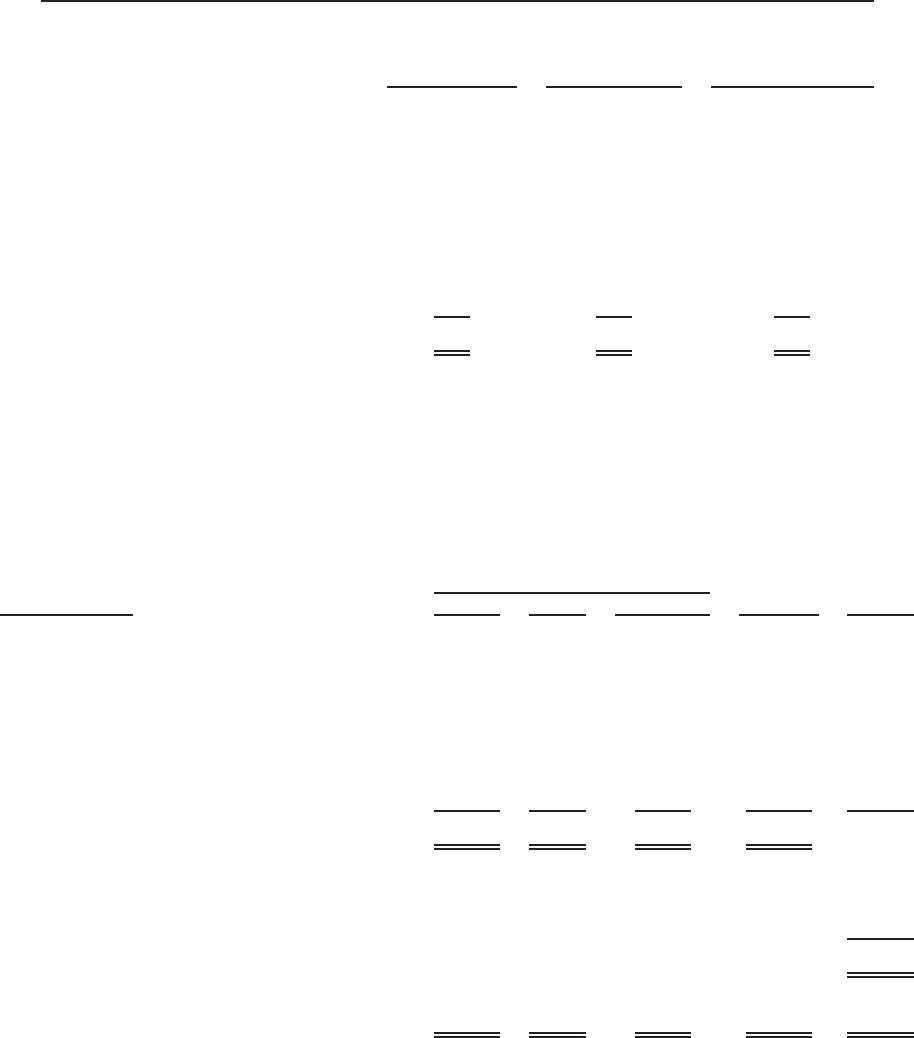
The tables below show the composition and status of the Managed Private Education Loan portfolio aged
by number of months in active repayment status (months for which a scheduled monthly payment was due).
As indicated in the tables, the percentage of loans in forbearance status decreases the longer the loans have
been in active repayment status. At December 31, 2009, loans in forbearance status as a percentage of loans in
repayment and forbearance are 7.3 percent for loans that have been in active repayment status for less than
25 months. The percentage drops to 1.8 percent for loans that have been in active repayment status for more
than 48 months. Approximately 86 percent of our Managed Private Education Loans in forbearance status have
been in active repayment status less than 25 months.
December 31, 2009 0 to 24 25 to 48 More than 48
Not Yet in
Repayment Total
Monthly Scheduled Payments Due
Loans in-school/grace/deferment ............. $ — $ — $ — $11,456 $11,456
Loans in forbearance ...................... 1,224 136 60 — 1,420
Loans in repayment — current ............... 13,122 5,194 3,092 — 21,408
Loans in repayment — delinquent 31-60 days .... 779 135 65 — 979
Loans in repayment — delinquent 61-90 days .... 386 71 34 — 491
Loans in repayment — delinquent greater than
90 days .............................. 1,210 193 85 — 1,488
Total .................................. $16,721 $5,729 $3,336 $11,456 37,242
Unamortized discount ..................... (908)
Receivable for partially charged-off loans ....... 728
Allowance for loan losses .................. (1,967)
Total Managed Private Education Loans, net .... $35,095
Loans in forbearance as a percentage of loans in
repayment and forbearance ................ 7.3% 2.4% 1.8% —% 5.5%
71