Sallie Mae 2009 Annual Report Download - page 135
Download and view the complete annual report
Please find page 135 of the 2009 Sallie Mae annual report below. You can navigate through the pages in the report by either clicking on the pages listed below, or by using the keyword search tool below to find specific information within the annual report.-
 1
1 -
2
-
3
-
4
-
5
-
6
-
7
-
8
-
9
-
10
-
11
-
12
-
13
-
14
-
15
-
16
-
17
-
18
-
19
-
20
-
21
-
22
-
23
-
24
-
25
-
26
-
27
-
28
-
29
-
30
-
31
-
32
-
33
-
34
-
35
-
36
-
37
-
38
-
39
-
40
-
41
-
42
-
43
-
44
-
45
-
46
-
47
-
48
-
49
-
50
-
51
-
52
-
53
-
54
-
55
-
56
-
57
-
58
-
59
-
60
-
61
-
62
-
63
-
64
-
65
-
66
-
67
-
68
-
69
-
70
-
71
-
72
-
73
-
74
-
75
-
76
-
77
-
78
-
79
-
80
-
81
-
82
-
83
-
84
-
85
-
86
-
87
-
88
-
89
-
90
-
91
-
92
-
93
-
94
-
95
-
96
-
97
-
98
-
99
-
100
-
101
-
102
-
103
-
104
-
105
-
106
-
107
-
108
-
109
-
110
-
111
-
112
-
113
-
114
-
115
-
116
-
117
-
118
-
119
-
120
-
121
-
122
-
123
-
124
-
 125
125 -
 126
126 -
 127
127 -
 128
128 -
 129
129 -
 130
130 -
 131
131 -
 132
132 -
 133
133 -
 134
134 -
 135
135 -
 136
136 -
 137
137 -
 138
138 -
 139
139 -
 140
140 -
 141
141 -
 142
142 -
 143
143 -
 144
144 -
 145
145 -
146
-
147
-
148
-
149
-
150
-
151
-
152
-
153
-
154
-
155
-
156
-
157
-
158
-
159
-
160
-
161
-
162
-
163
-
164
-
165
-
166
-
167
-
168
-
169
-
170
-
171
-
172
-
173
-
174
-
175
-
176
-
177
-
178
-
179
-
180
-
181
-
182
-
183
-
184
-
185
-
186
-
187
-
188
-
189
-
190
-
191
-
192
-
193
-
194
-
195
-
196
-
197
-
198
-
199
-
200
-
201
-
202
-
203
-
204
-
205
-
206
-
207
-
208
-
209
-
210
-
211
-
212
-
213
-
214
-
215
-
216
-
217
-
218
-
219
-
220
-
221
-
222
-
223
-
224
-
225
-
226
-
227
-
228
-
229
-
230
-
231
-
232
-
233
-
234
-
235
-
236
-
237
-
238
-
239
-
240
-
241
-
242
-
243
-
244
-
245
-
246
-
247
-
248
-
249
-
250
-
251
-
252
-
253
-
254
-
255
-
256
 |
 |

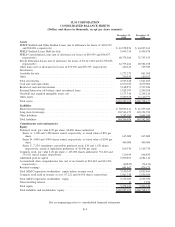
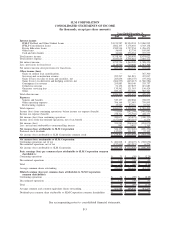
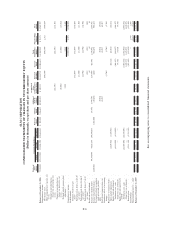
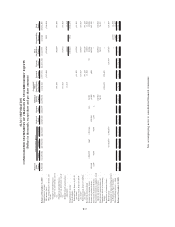
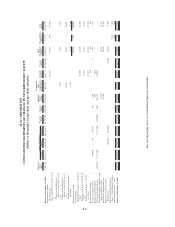
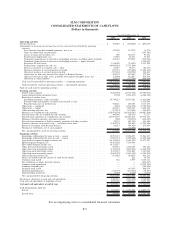
SLM CORPORATION
CONSOLIDATED STATEMENTS OF CHANGES IN STOCKHOLDERS’ EQUITY
(Dollars in thousands, except share and per share amounts)
Preferred
Stock
Shares Issued Treasury Outstanding
Preferred
Stock
Common
Stock
Additional
Paid-In
Capital
Accumulated
Other
Comprehensive
Income (Loss)
Retained
Earnings
Treasury
Stock
Total
Stockholders’
Equity
Noncontrolling
Interest
Total
Equity
Common Stock Shares
Balance at December 31, 2008 .... 8,449,770 534,411,271 (66,958,400) 467,452,871 $1,714,770 $106,883 $4,684,112 $(76,476) $426,175 $(1,856,394) $4,999,070 $ 7,270 $5,006,340
Comprehensive income:
Net income (loss) ........... 324,138 324,138 847 324,985
Other comprehensive income, net of
tax:
Change in unrealized gains
(losses) on investments, net of
tax................. 2,872 2,872 2,872
Change in unrealized gains
(losses) on derivatives, net of
tax................. 40,087 40,087 40,087
Defined benefit pension plans
adjustment . ........... (7,308) (7,308) (7,308)
Comprehensive income ......... 359,789 847 360,636
Cash dividends:
Preferred stock, Series A ($3.49 per
share) . . . . . . ........... (11,500) (11,500) (11,500)
Preferred stock, Series B ($1.76 per
share) . . . . . . ........... (6,752) (6,752) (6,752)
Preferred stock, Series C ($72.50
per share) . . . ........... (97,523) (97,523) (97,523)
Restricted stock dividend ........ (10) (10) (10)
Issuance of common shares . . . .... 536,036 98 536,134 107 3,186 5 3,298 3,298
Issuance of preferred shares . . . .... 650 (650) — —
Conversion of preferred shares . .... (339,400) 17,272,269 17,272,269 (339,400) 3,454 365,357 (29,411) — —
Tax benefit related to employee stock
option and purchase plans . . .... (9,710) (9,710) (9,710)
Stock-based compensation cost . .... 47,296 47,296 47,296
Repurchase of common shares:
Benefit plans . . . ........... (263,640) (263,640) (5,349) (5,349) (5,349)
Sale of international Purchased
Paper — Non-Mortgage business . . — (7,257) (7,257)
Noncontrolling interest — other .... — (847) (847)
Balance at December 31, 2009 .... 8,110,370 552,219,576 (67,221,942) 484,997,634 $1,375,370 $110,444 $5,090,891 $(40,825) $604,467 $(1,861,738) $5,278,609 $ 13 $5,278,622
See accompanying notes to consolidated financial statements.
F-8