Sallie Mae 2009 Annual Report Download - page 38
Download and view the complete annual report
Please find page 38 of the 2009 Sallie Mae annual report below. You can navigate through the pages in the report by either clicking on the pages listed below, or by using the keyword search tool below to find specific information within the annual report.-
 1
1 -
2
-
3
-
4
-
5
-
6
-
7
-
8
-
9
-
10
-
11
-
12
-
13
-
14
-
15
-
16
-
17
-
18
-
19
-
20
-
21
-
22
-
23
-
24
-
25
-
26
-
27
-
 28
28 -
 29
29 -
 30
30 -
 31
31 -
 32
32 -
 33
33 -
 34
34 -
 35
35 -
 36
36 -
 37
37 -
 38
38 -
 39
39 -
 40
40 -
 41
41 -
 42
42 -
 43
43 -
 44
44 -
 45
45 -
 46
46 -
 47
47 -
 48
48 -
49
-
50
-
51
-
52
-
53
-
54
-
55
-
56
-
57
-
58
-
59
-
60
-
61
-
62
-
63
-
64
-
65
-
66
-
67
-
68
-
69
-
70
-
71
-
72
-
73
-
74
-
75
-
76
-
77
-
78
-
79
-
80
-
81
-
82
-
83
-
84
-
85
-
86
-
87
-
88
-
89
-
90
-
91
-
92
-
93
-
94
-
95
-
96
-
97
-
98
-
99
-
100
-
101
-
102
-
103
-
104
-
105
-
106
-
107
-
108
-
109
-
110
-
111
-
112
-
113
-
114
-
115
-
116
-
117
-
118
-
119
-
120
-
121
-
122
-
123
-
124
-
125
-
126
-
127
-
128
-
129
-
130
-
131
-
132
-
133
-
134
-
135
-
136
-
137
-
138
-
139
-
140
-
141
-
142
-
143
-
144
-
145
-
146
-
147
-
148
-
149
-
150
-
151
-
152
-
153
-
154
-
155
-
156
-
157
-
158
-
159
-
160
-
161
-
162
-
163
-
164
-
165
-
166
-
167
-
168
-
169
-
170
-
171
-
172
-
173
-
174
-
175
-
176
-
177
-
178
-
179
-
180
-
181
-
182
-
183
-
184
-
185
-
186
-
187
-
188
-
189
-
190
-
191
-
192
-
193
-
194
-
195
-
196
-
197
-
198
-
199
-
200
-
201
-
202
-
203
-
204
-
205
-
206
-
207
-
208
-
209
-
210
-
211
-
212
-
213
-
214
-
215
-
216
-
217
-
218
-
219
-
220
-
221
-
222
-
223
-
224
-
225
-
226
-
227
-
228
-
229
-
230
-
231
-
232
-
233
-
234
-
235
-
236
-
237
-
238
-
239
-
240
-
241
-
242
-
243
-
244
-
245
-
246
-
247
-
248
-
249
-
250
-
251
-
252
-
253
-
254
-
255
-
256
 |
 |

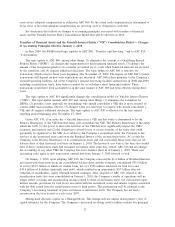
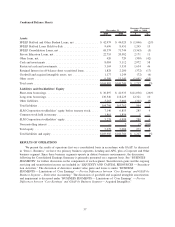
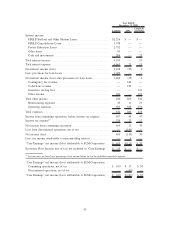
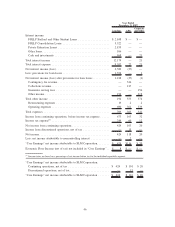
Condensed Balance Sheets
2009 2008 $ %
December 31,
Increase (Decrease)
2009 vs. 2008
Assets
FFELP Stafford and Other Student Loans, net ............... $ 42,979 $ 44,025 $ (1,046) (2)%
FFELP Stafford Loans Held-for-Sale . . . ................... 9,696 8,451 1,245 15
FFELP Consolidation Loans, net ......................... 68,379 71,744 (3,365) (5)
Private Education Loans, net ............................ 22,753 20,582 2,171 11
Other loans, net...................................... 420 729 (309) (42)
Cash and investments ................................. 8,084 5,112 2,972 58
Restricted cash and investments .......................... 5,169 3,535 1,634 46
Retained Interest in off-balance sheet securitized loans ......... 1,828 2,200 (372) (17)
Goodwill and acquired intangible assets, net ................ 1,177 1,249 (72) (6)
Other assets ........................................ 9,500 11,141 (1,641) (15)
Total assets ......................................... $169,985 $168,768 $ 1,217 1%
Liabilities and Stockholders’ Equity
Short-term borrowings ................................. $ 30,897 $ 41,933 $(11,036) (26)%
Long-term borrowings ................................. 130,546 118,225 12,321 10
Other liabilities ...................................... 3,263 3,604 (341) (9)
Total liabilities ...................................... 164,706 163,762 944 1
SLM Corporation stockholders’ equity before treasury stock ..... 7,140 6,855 285 4
Common stock held in treasury .......................... 1,861 1,856 5 —
SLM Corporation stockholders’ equity . . ................... 5,279 4,999 280 6
Noncontrolling interest ................................ — 7 (7) (100)
Total equity ........................................ 5,279 5,006 273 5
Total liabilities and equity .............................. $169,985 $168,768 $ 1,217 1%
RESULTS OF OPERATIONS
We present the results of operations first on a consolidated basis in accordance with GAAP. As discussed
in “Item 1. Business,” we have two primary business segments, Lending and APG, plus a Corporate and Other
business segment. Since these business segments operate in distinct business environments, the discussion
following the Consolidated Earnings Summary is primarily presented on a segment basis. See “BUSINESS
SEGMENTS” for further discussion on the components of each segment. Securitization gains and the ongoing
servicing and securitization income are included in “LIQUIDITY AND CAPITAL RESOURCES — Securitiza-
tion Activities.” The discussion of derivative market value gains and losses is under “BUSINESS
SEGMENTS — Limitations of ‘Core Earnings’ — Pre-tax Differences between ‘Core Earnings’ and GAAP by
Business Segment — Derivative Accounting.” The discussion of goodwill and acquired intangible amortization
and impairment is discussed under “BUSINESS SEGMENTS — Limitations of ‘Core Earnings’ — Pre-tax
Differences between ‘Core Earnings’ and GAAP by Business Segment — Acquired Intangibles.”
37