Sallie Mae 2009 Annual Report Download - page 23
Download and view the complete annual report
Please find page 23 of the 2009 Sallie Mae annual report below. You can navigate through the pages in the report by either clicking on the pages listed below, or by using the keyword search tool below to find specific information within the annual report.-
 1
1 -
2
-
3
-
4
-
5
-
6
-
7
-
8
-
9
-
10
-
11
-
12
-
 13
13 -
 14
14 -
 15
15 -
 16
16 -
 17
17 -
 18
18 -
 19
19 -
 20
20 -
 21
21 -
 22
22 -
 23
23 -
 24
24 -
 25
25 -
 26
26 -
 27
27 -
 28
28 -
 29
29 -
 30
30 -
 31
31 -
 32
32 -
 33
33 -
34
-
35
-
36
-
37
-
38
-
39
-
40
-
41
-
42
-
43
-
44
-
45
-
46
-
47
-
48
-
49
-
50
-
51
-
52
-
53
-
54
-
55
-
56
-
57
-
58
-
59
-
60
-
61
-
62
-
63
-
64
-
65
-
66
-
67
-
68
-
69
-
70
-
71
-
72
-
73
-
74
-
75
-
76
-
77
-
78
-
79
-
80
-
81
-
82
-
83
-
84
-
85
-
86
-
87
-
88
-
89
-
90
-
91
-
92
-
93
-
94
-
95
-
96
-
97
-
98
-
99
-
100
-
101
-
102
-
103
-
104
-
105
-
106
-
107
-
108
-
109
-
110
-
111
-
112
-
113
-
114
-
115
-
116
-
117
-
118
-
119
-
120
-
121
-
122
-
123
-
124
-
125
-
126
-
127
-
128
-
129
-
130
-
131
-
132
-
133
-
134
-
135
-
136
-
137
-
138
-
139
-
140
-
141
-
142
-
143
-
144
-
145
-
146
-
147
-
148
-
149
-
150
-
151
-
152
-
153
-
154
-
155
-
156
-
157
-
158
-
159
-
160
-
161
-
162
-
163
-
164
-
165
-
166
-
167
-
168
-
169
-
170
-
171
-
172
-
173
-
174
-
175
-
176
-
177
-
178
-
179
-
180
-
181
-
182
-
183
-
184
-
185
-
186
-
187
-
188
-
189
-
190
-
191
-
192
-
193
-
194
-
195
-
196
-
197
-
198
-
199
-
200
-
201
-
202
-
203
-
204
-
205
-
206
-
207
-
208
-
209
-
210
-
211
-
212
-
213
-
214
-
215
-
216
-
217
-
218
-
219
-
220
-
221
-
222
-
223
-
224
-
225
-
226
-
227
-
228
-
229
-
230
-
231
-
232
-
233
-
234
-
235
-
236
-
237
-
238
-
239
-
240
-
241
-
242
-
243
-
244
-
245
-
246
-
247
-
248
-
249
-
250
-
251
-
252
-
253
-
254
-
255
-
256
 |
 |
Item 7. Management’s Discussion and Analysis of Financial Condition and Results of Operations
MANAGEMENT’S DISCUSSION AND ANALYSIS OF
FINANCIAL CONDITION AND RESULTS OF OPERATIONS
Years ended December 31, 2007-2009
(Dollars in millions, except per share amounts, unless otherwise stated)
FORWARD-LOOKING AND CAUTIONARY STATEMENTS
Some of the statements contained in this Annual Report discuss future expectations and business
strategies or include other “forward-looking” information. These statements are subject to known and unknown
risks, uncertainties and other factors that could cause the actual results to differ materially from those
contemplated by the statements. The forward-looking information is based on various factors and was derived
using numerous assumptions.
OVERVIEW
This section provides an overview of the Company’s 2009 business results from a financial perspective.
Certain financial impacts of funding and liquidity, loan losses, asset growth and net interest margin, fee
income, the distressed debt purchased paper business, operating expenses, and capital adequacy are summa-
rized below.
The income statement amounts discussed in this Overview section are on a “Core Earning” basis.
Although “Core Earnings” is the basis used for the Company’s segment disclosures required under GAAP (see
Note 20, “Segment Reporting” to the consolidated financial statements), the consolidation of the individual
segments’ income statements is considered a non-GAAP financial measure and thus is not considered to be
presented in accordance with GAAP. See “RESULTS OF OPERATIONS,” below, for a discussion of income
statement amounts on a GAAP basis. See “BUSINESS SEGMENTS — Limitations of ‘Core Earnings’ — Pre-
tax Differences between ‘Core Earnings’ and GAAP by Business Segment” for a discussion of “Core Earnings”
and a reconciliation of “Core Earnings” income to GAAP income.
In the second quarter of 2009, the Department of Education (“ED”) named Sallie Mae as one of four
private sector servicers awarded a servicing contract (the “ED Servicing Contract”) to service loans. The
contract covers the servicing of all federally-owned student loans, including loans under the DSLP and the
servicing of FFELP loans purchased by ED as part of the Loan Purchase Commitment Program (“Purchase
Program”) pursuant to The Ensuring Continued Access to Student Loans Act of 2008 (“ECASLA”). See
“LIQUIDITY AND CAPITAL RESOURCES — ED Funding Programs” for a further discussion. Beginning in
2010, the contract will also cover the servicing of new Direct Loans. The contract has an initial term of five
years with one, five-year renewal at the option of ED.
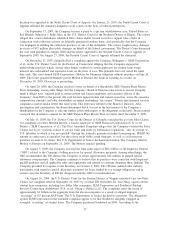
Through December 31, 2009, the Company has sold to ED approximately $18.5 billion face amount of
loans as part of the Purchase Program. Borrowings of $18.5 billion related to the Loan Purchase Participation
Program (“Participation Program”) pursuant to ECASLA were paid down in connection with these loan sales.
The Company recognized a $284 million gain in 2009 related to this loan sale. The Company is servicing
approximately 2 million accounts under the ED Servicing Contract as of December 31, 2009. This amount
serviced includes loans sold by the Company to ED as well as loans sold by other companies to ED.
As discussed in the Business section, legislative changes to the FFELP, the credit markets and the
economic downturn impacted the Company’s financial results for 2008 and 2009. The Company reported
$597 million in “Core Earnings” net income in 2009, an increase from $526 million in 2008.
Funding and Liquidity
In 2009, we extended the duration of our liabilities by executing term financings to replace short-term
funding. In 2009, we completed a total of $5.9 billion of FFELP loan securitizations, $14.6 billion in funding
22