Sallie Mae 2009 Annual Report Download - page 70
Download and view the complete annual report
Please find page 70 of the 2009 Sallie Mae annual report below. You can navigate through the pages in the report by either clicking on the pages listed below, or by using the keyword search tool below to find specific information within the annual report.-
 1
1 -
2
-
3
-
4
-
5
-
6
-
7
-
8
-
9
-
10
-
11
-
12
-
13
-
14
-
15
-
16
-
17
-
18
-
19
-
20
-
21
-
22
-
23
-
24
-
25
-
26
-
27
-
28
-
29
-
30
-
31
-
32
-
33
-
34
-
35
-
36
-
37
-
38
-
39
-
40
-
41
-
42
-
43
-
44
-
45
-
46
-
47
-
48
-
49
-
50
-
51
-
52
-
53
-
54
-
55
-
56
-
57
-
58
-
59
-
 60
60 -
 61
61 -
 62
62 -
 63
63 -
 64
64 -
 65
65 -
 66
66 -
 67
67 -
 68
68 -
 69
69 -
 70
70 -
 71
71 -
 72
72 -
 73
73 -
 74
74 -
 75
75 -
 76
76 -
 77
77 -
 78
78 -
 79
79 -
 80
80 -
81
-
82
-
83
-
84
-
85
-
86
-
87
-
88
-
89
-
90
-
91
-
92
-
93
-
94
-
95
-
96
-
97
-
98
-
99
-
100
-
101
-
102
-
103
-
104
-
105
-
106
-
107
-
108
-
109
-
110
-
111
-
112
-
113
-
114
-
115
-
116
-
117
-
118
-
119
-
120
-
121
-
122
-
123
-
124
-
125
-
126
-
127
-
128
-
129
-
130
-
131
-
132
-
133
-
134
-
135
-
136
-
137
-
138
-
139
-
140
-
141
-
142
-
143
-
144
-
145
-
146
-
147
-
148
-
149
-
150
-
151
-
152
-
153
-
154
-
155
-
156
-
157
-
158
-
159
-
160
-
161
-
162
-
163
-
164
-
165
-
166
-
167
-
168
-
169
-
170
-
171
-
172
-
173
-
174
-
175
-
176
-
177
-
178
-
179
-
180
-
181
-
182
-
183
-
184
-
185
-
186
-
187
-
188
-
189
-
190
-
191
-
192
-
193
-
194
-
195
-
196
-
197
-
198
-
199
-
200
-
201
-
202
-
203
-
204
-
205
-
206
-
207
-
208
-
209
-
210
-
211
-
212
-
213
-
214
-
215
-
216
-
217
-
218
-
219
-
220
-
221
-
222
-
223
-
224
-
225
-
226
-
227
-
228
-
229
-
230
-
231
-
232
-
233
-
234
-
235
-
236
-
237
-
238
-
239
-
240
-
241
-
242
-
243
-
244
-
245
-
246
-
247
-
248
-
249
-
250
-
251
-
252
-
253
-
254
-
255
-
256
 |
 |

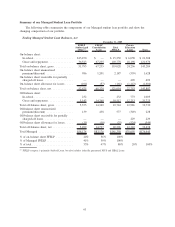
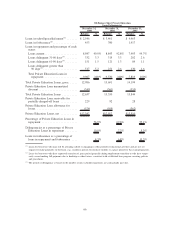
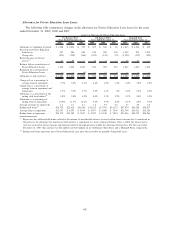
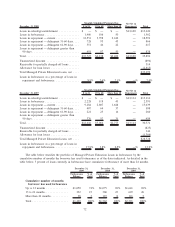
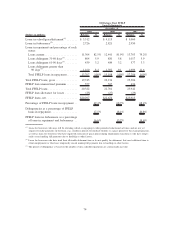
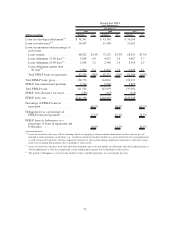
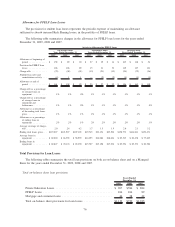
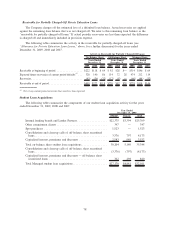
The following table provides the detail for our traditional and non-traditional Managed Private Education
Loans at December 31, 2009, 2008 and 2007.
Traditional
Non-
Traditional Total Traditional
Non-
Traditional Total Traditional
Non-
Traditional Total
December 31, 2009 December 31, 2008 December 31, 2007
Ending total loans
(1)
....... $33,223 $4,747 $37,970 $31,101 $5,107 $36,208 $25,848 $4,669 $30,517
Ending loans in repayment . . . 21,453 2,913 24,366 17,715 2,997 20,712 12,711 2,155 14,866
Private Education Loan
allowance for losses . . .... 1,056 911 1,967 859 954 1,813 495 871 1,366
Charge-offs as a percentage of
average loans in
repayment . . . ......... 3.6% 21.4% 6.0% 1.4% 11.1% 2.9% 1.2% 9.5% 2.5%
Allowance as a percentage of
ending total loan
balance
(1)
............. 3.2% 19.2% 5.2% 2.8% 18.7% 5.0% 1.9% 18.7% 4.5%
Allowance as a percentage of
ending loans in repayment . . 4.9% 31.3% 8.1% 4.8% 31.8% 8.8% 3.9% 40.4% 9.2%
Average coverage of charge-
offs................. 1.6 1.5 1.5 4.2 3.5 3.8 3.6 4.6 4.2
Delinquencies as a percentage
of Private Education Loans
in repayment. . ......... 9.5% 31.4% 12.1% 7.1% 28.9% 10.2% 5.2% 26.3% 8.3%
Delinquencies greater than
90 days as a percentage of
Private Education Loans in
repayment . . . ......... 4.6% 17.5% 6.1% 2.6% 12.7% 4.0% 1.7% 11.1% 3.1%
Loans in forbearance as a
percentage of loans in
repayment and
forbearance . . ......... 5.3% 7.1% 5.5% 6.7% 9.0% 7.0% 12.8% 19.4% 13.9%
Percentage of Private
Education Loans with a
cosigner .............. 61% 28% 57% 59% 26% 55% 57% 25% 52%
Average FICO at origination . . 725 623 713 723 622 710 723 620 708
(1)
Ending total loans represents gross Private Education Loans, plus the receivable for partially charged-off loans.
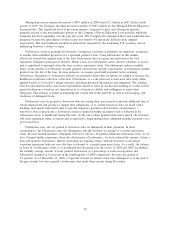
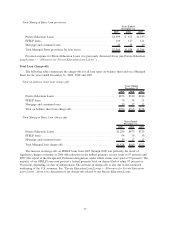
Managed provision expense for Private Education Loans was $1.4 billion in 2009 compared to $874 mil-
lion for 2008 and $1.2 billion in 2007. The increase in provision expense from 2008 to 2009 is a result of the
weak U.S. economy and the continued uncertainty surrounding the U.S. economy. As a result of the economy,
provision expense has remained elevated since the fourth quarter of 2008. The Private Education Loan
portfolio experienced a significant increase in delinquencies through the first quarter of 2009 (as of March 31,
2009, delinquencies as a percentage of loans in repayment was 13.4 percent); however, delinquencies as a
percentage of loans in repayment declined in the second, third and fourth quarters of 2009. The Company
believes charge-offs peaked in the third quarter of 2009 and will decline in future quarters as evidenced by the
33 percent decline in charge-offs that occurred between the third and fourth quarters of 2009. The increase in
charge-off levels through the third quarter of 2009 was generally anticipated and was previously reflected in
our allowance for loan losses. As of December 31, 2009, the Managed Private Education Loan allowance
coverage of current-year charge-offs ratio was 1.5 compared to 3.8 as of December 31, 2008. This decrease in
the allowance coverage ratio was expected as evidenced by the charge-off activity during 2009, noted above.
The allowance for loan losses as a percentage of ending Private Education Loans in repayment has remained
relatively consistent at approximately 8.1 percent at December 31, 2009 and 8.8 percent at December 31,
2008. Managed Private Education Loan delinquencies as a percentage of loans in repayment increased from
10.2 percent to 12.1 percent from December 31, 2008 to December 31, 2009. Managed Private Education
Loans in forbearance as a percentage of loans in repayment and forbearance decreased from 7.0 percent as of
December 31, 2008 to 5.5 percent at December 31, 2009. As part of concluding that the allowance for loan
losses for Private Education Loans is appropriate as of December 31, 2009, the Company analyzed changes in
the key ratios disclosed in the tables above.
69