Sallie Mae 2009 Annual Report Download - page 188
Download and view the complete annual report
Please find page 188 of the 2009 Sallie Mae annual report below. You can navigate through the pages in the report by either clicking on the pages listed below, or by using the keyword search tool below to find specific information within the annual report.-
 1
1 -
2
-
3
-
4
-
5
-
6
-
7
-
8
-
9
-
10
-
11
-
12
-
13
-
14
-
15
-
16
-
17
-
18
-
19
-
20
-
21
-
22
-
23
-
24
-
25
-
26
-
27
-
28
-
29
-
30
-
31
-
32
-
33
-
34
-
35
-
36
-
37
-
38
-
39
-
40
-
41
-
42
-
43
-
44
-
45
-
46
-
47
-
48
-
49
-
50
-
51
-
52
-
53
-
54
-
55
-
56
-
57
-
58
-
59
-
60
-
61
-
62
-
63
-
64
-
65
-
66
-
67
-
68
-
69
-
70
-
71
-
72
-
73
-
74
-
75
-
76
-
77
-
78
-
79
-
80
-
81
-
82
-
83
-
84
-
85
-
86
-
87
-
88
-
89
-
90
-
91
-
92
-
93
-
94
-
95
-
96
-
97
-
98
-
99
-
100
-
101
-
102
-
103
-
104
-
105
-
106
-
107
-
108
-
109
-
110
-
111
-
112
-
113
-
114
-
115
-
116
-
117
-
118
-
119
-
120
-
121
-
122
-
123
-
124
-
125
-
126
-
127
-
128
-
129
-
130
-
131
-
132
-
133
-
134
-
135
-
136
-
137
-
138
-
139
-
140
-
141
-
142
-
143
-
144
-
145
-
146
-
147
-
148
-
149
-
150
-
151
-
152
-
153
-
154
-
155
-
156
-
157
-
158
-
159
-
160
-
161
-
162
-
163
-
164
-
165
-
166
-
167
-
168
-
169
-
170
-
171
-
172
-
173
-
174
-
175
-
176
-
177
-
 178
178 -
 179
179 -
 180
180 -
 181
181 -
 182
182 -
 183
183 -
 184
184 -
 185
185 -
 186
186 -
 187
187 -
 188
188 -
 189
189 -
 190
190 -
 191
191 -
 192
192 -
 193
193 -
 194
194 -
 195
195 -
 196
196 -
 197
197 -
 198
198 -
199
-
200
-
201
-
202
-
203
-
204
-
205
-
206
-
207
-
208
-
209
-
210
-
211
-
212
-
213
-
214
-
215
-
216
-
217
-
218
-
219
-
220
-
221
-
222
-
223
-
224
-
225
-
226
-
227
-
228
-
229
-
230
-
231
-
232
-
233
-
234
-
235
-
236
-
237
-
238
-
239
-
240
-
241
-
242
-
243
-
244
-
245
-
246
-
247
-
248
-
249
-
250
-
251
-
252
-
253
-
254
-
255
-
256
 |
 |

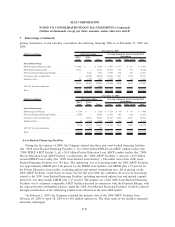
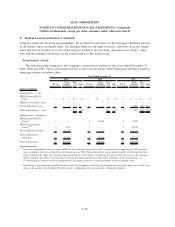
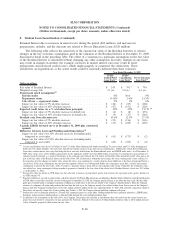
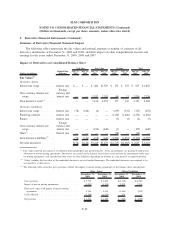
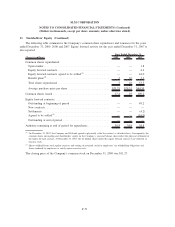
8. Student Loan Securitization (Continued)
The table below shows the Company’s off-balance sheet Private Education Loan delinquency trends as of
December 31, 2009 and 2008.
Balance % Balance %
December 31,
2009
December 31,
2008
Off-Balance Sheet Private Education Loan
Delinquencies
(Dollars in millions)
Loans in-school/grace/deferment
(1)
..................... $ 2,546 $ 3,461
Loans in forbearance
(2)
.............................. 453 700
Loans in repayment and percentage of each status:
Loans current ................................... 8,987 90.0% 8,843 92.8%
Loans delinquent 31-60 days
(3)
...................... 332 3.3 315 3.3
Loans delinquent 61-90 days ........................ 151 1.5 121 1.3
Loans delinquent greater than 90 days ................. 517 5.2 251 2.6
Total off-balance sheet Private Education Loans in
repayment .................................... 9,987 100% 9,530 100%
Total off-balance sheet Private Education Loans, gross ....... $12,986 $13,691
(1)
Loans for borrowers who may still be attending school or engaging in other permitted educational activities and are not yet required to
make payments on the loans, e.g., residency periods for medical students or a grace period for bar exam preparation.
(2)
Loans for borrowers who have requested extension of grace period generally during employment transition or who have temporarily
ceased making full payments due to hardship or other factors, consistent with the established loan program servicing policies and
procedures.
(3)
The period of delinquency is based on the number of days scheduled payments are contractually past due.
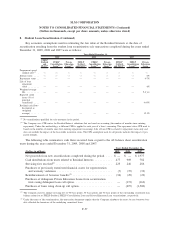
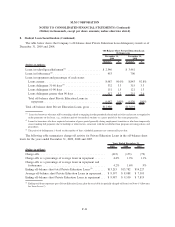
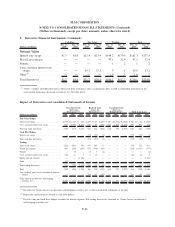
The following table summarizes charge-off activity for Private Education Loans in the off-balance sheet
trusts for the years ended December 31, 2009, 2008 and 2007.
2009 2008 2007
Years Ended December 31,
(Dollars in millions)
Charge-offs .......................................... (423) (153) (79)
Charge-offs as a percentage of average loans in repayment ....... 4.4% 1.9% 1.1%
Charge-offs as a percentage of average loans in repayment and
forbearance ........................................ 4.2% 1.6% .9%
Ending off-balance sheet total Private Education Loans
(1)
........ $13,215 $13,782 $14,227
Average off-balance sheet Private Education Loans in repayment . . $ 9,597 $ 8,088 $ 7,305
Ending off-balance sheet Private Education Loans in repayment . . . $ 9,987 $ 9,530 $ 7,819
(1)
Ending total loans represents gross Private Education Loans, plus the receivable for partially charged-off loans (see Note 4,“Allowance
for Loan Losses”).
F-61
SLM CORPORATION
NOTES TO CONSOLIDATED FINANCIAL STATEMENTS (Continued)
(Dollars in thousands, except per share amounts, unless otherwise stated)