Sallie Mae 2009 Annual Report Download - page 230
Download and view the complete annual report
Please find page 230 of the 2009 Sallie Mae annual report below. You can navigate through the pages in the report by either clicking on the pages listed below, or by using the keyword search tool below to find specific information within the annual report.-
 1
1 -
2
-
3
-
4
-
5
-
6
-
7
-
8
-
9
-
10
-
11
-
12
-
13
-
14
-
15
-
16
-
17
-
18
-
19
-
20
-
21
-
22
-
23
-
24
-
25
-
26
-
27
-
28
-
29
-
30
-
31
-
32
-
33
-
34
-
35
-
36
-
37
-
38
-
39
-
40
-
41
-
42
-
43
-
44
-
45
-
46
-
47
-
48
-
49
-
50
-
51
-
52
-
53
-
54
-
55
-
56
-
57
-
58
-
59
-
60
-
61
-
62
-
63
-
64
-
65
-
66
-
67
-
68
-
69
-
70
-
71
-
72
-
73
-
74
-
75
-
76
-
77
-
78
-
79
-
80
-
81
-
82
-
83
-
84
-
85
-
86
-
87
-
88
-
89
-
90
-
91
-
92
-
93
-
94
-
95
-
96
-
97
-
98
-
99
-
100
-
101
-
102
-
103
-
104
-
105
-
106
-
107
-
108
-
109
-
110
-
111
-
112
-
113
-
114
-
115
-
116
-
117
-
118
-
119
-
120
-
121
-
122
-
123
-
124
-
125
-
126
-
127
-
128
-
129
-
130
-
131
-
132
-
133
-
134
-
135
-
136
-
137
-
138
-
139
-
140
-
141
-
142
-
143
-
144
-
145
-
146
-
147
-
148
-
149
-
150
-
151
-
152
-
153
-
154
-
155
-
156
-
157
-
158
-
159
-
160
-
161
-
162
-
163
-
164
-
165
-
166
-
167
-
168
-
169
-
170
-
171
-
172
-
173
-
174
-
175
-
176
-
177
-
178
-
179
-
180
-
181
-
182
-
183
-
184
-
185
-
186
-
187
-
188
-
189
-
190
-
191
-
192
-
193
-
194
-
195
-
196
-
197
-
198
-
199
-
200
-
201
-
202
-
203
-
204
-
205
-
206
-
207
-
208
-
209
-
210
-
211
-
212
-
213
-
214
-
215
-
216
-
217
-
218
-
219
-
 220
220 -
 221
221 -
 222
222 -
 223
223 -
 224
224 -
 225
225 -
 226
226 -
 227
227 -
 228
228 -
 229
229 -
 230
230 -
 231
231 -
 232
232 -
 233
233 -
 234
234 -
 235
235 -
 236
236 -
 237
237 -
 238
238 -
 239
239 -
 240
240 -
241
-
242
-
243
-
244
-
245
-
246
-
247
-
248
-
249
-
250
-
251
-
252
-
253
-
254
-
255
-
256
 |
 |

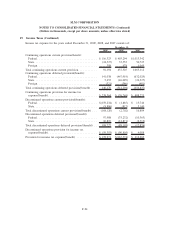
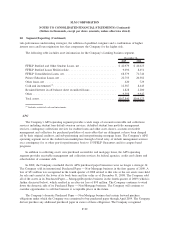
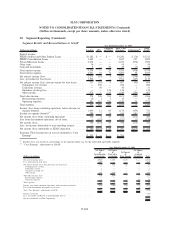
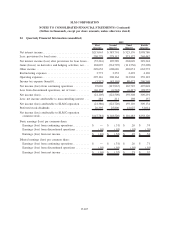
20. Segment Reporting (Continued)
Lending APG
Corporate
and Other
Total “Core
Earnings” Adjustments
(2)
Total
GAAP
Year Ended December 31, 2008
(Dollars in millions)
Interest income:
FFELP Stafford and Other Student Loans . . . . . . . . . . . $2,216 $ — $ — $2,216 $ (221) $1,995
FFELP Consolidation Loans . . . . . . . . . . . . . . . . . . . . 3,748 — — 3,748 (569) 3,179
Private Education Loans . . . . . . . . . . . . . . . . . . . . . . . 2,752 — — 2,752 (1,015) 1,737
Other loans . . . . . . . . . . . . . . . . . . . . . . . . . . . . . . . . 83 — — 83 — 83
Cash and investments . . . . . . . . . . . . . . . . . . . . . . . . . 304 — 25 329 (53) 276
Total interest income . . . . . . . . . . . . . . . . . . . . . . . . . 9,103 — 25 9,128 (1,858) 7,270
Total interest expense . . . . . . . . . . . . . . . . . . . . . . . . . 6,665 25 19 6,709 (804) 5,905
Net interest income (loss) . . . . . . . . . . . . . . . . . . . . . . 2,438 (25) 6 2,419 (1,054) 1,365
Less: provisions for loan losses . . . . . . . . . . . . . . . . . . 1,029 — — 1,029 (309) 720
Net interest income (loss) after provisions for loan losses . . . 1,409 (25) 6 1,390 (745) 645
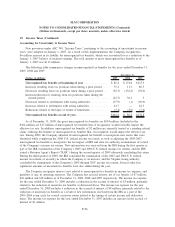
Contingency fee revenue . . . . . . . . . . . . . . . . . . . . . — 340 — 340 — 340
Collections revenue . . . . . . . . . . . . . . . . . . . . . . . . . — 129 — 129 (1) 128
Guarantor servicing fees . . . . . . . . . . . . . . . . . . . . . — — 121 121 — 121
Other income . . . . . . . . . . . . . . . . . . . . . . . . . . . . . 180 — 199 379 (356) 23
Total other income . . . . . . . . . . . . . . . . . . . . . . . . . . . 180 469 320 969 (357) 612
Restructuring expenses . . . . . . . . . . . . . . . . . . . . . . 49 11 23 83 — 83
Operating expenses . . . . . . . . . . . . . . . . . . . . . . . . . 583 389 256 1,228 88 1,316
Total expenses . . . . . . . . . . . . . . . . . . . . . . . . . . . . . . 632 400 279 1,311 88 1,399
Income (loss) from continuing operations, before income
tax expense (benefit) . . . . . . . . . . . . . . . . . . . . . . . . 957 44 47 1,048 (1,190) (142)
Income tax expense (benefit)
(1)
. . . . . . . . . . . . . . . . . . . 338 23 17 378 (454) (76)
Net income (loss) from continuing operations . . . . . . . . . 619 21 30 670 (736) (66)
Loss from discontinued operations, net of taxes . . . . . . . — (140) — (140) (3) (143)
Net income (loss) . . . . . . . . . . . . . . . . . . . . . . . . . . . . 619 (119) 30 530 (739) (209)
Less: net income attributable to noncontrolling interest . . — 4 — 4 — 4
Net income (loss) attributable to SLM Corporation . . . . . $ 619 $(123) $ 30 $ 526 $ (739) $ (213)
Economic Floor Income (net of tax) not included in
“Core Earnings” . . . . . . . . . . . . . . . . . . . . . . . . . . . $ 55 $ — $ — $ 55
(1)
Income taxes are based on a percentage of net income before tax for the individual reportable segment.
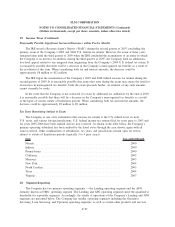
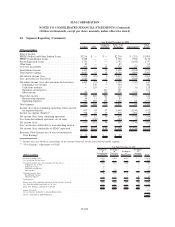
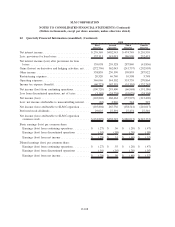
(2)
“Core Earnings” adjustments to GAAP:
(Dollars in millions)
Net Impact
of
Securitization
Accounting
Net Impact
of
Derivative
Accounting
Net Impact
of
Floor Income
Net Impact
of
Acquired
Intangibles Total
Year Ended December 31, 2008
Net interest income (loss) . . . . . . . . . . . . . . . . . . . . . . . . . . . . . . . . . . . . . . . . . . $(837) $(115) $(102) $ — $(1,054)
Less: provisions for loan losses . . . . . . . . . . . . . . . . . . . . . . . . . . . . . . . . . . . . . . . (309) — — — (309)
Net interest income (loss) after provisions for loan losses . . . . . . . . . . . . . . . . . . . . . . . . . (528) (115) (102) — (745)
Contingency fee revenue . . . . . . . . . . . . . . . . . . . . . . . . . . . . . . . . . . . . . . . . . — — — — —
Collections revenue . . . . . . . . . . . . . . . . . . . . . . . . . . . . . . . . . . . . . . . . . . . . (1) — — — (1)
Guarantor servicing fees . . . . . . . . . . . . . . . . . . . . . . . . . . . . . . . . . . . . . . . . . . — — — — —
Other income . . . . . . . . . . . . . . . . . . . . . . . . . . . . . . . . . . . . . . . . . . . . . . . . 89 (445) — — (356)
Total other income (loss) . . . . . . . . . . . . . . . . . . . . . . . . . . . . . . . . . . . . . . . . . . . 88 (445) — — (357)
Restructuring expenses . . . . . . . . . . . . . . . . . . . . . . . . . . . . . . . . . . . . . . . . . . — — — — —
Operating expenses . . . . . . . . . . . . . . . . . . . . . . . . . . . . . . . . . . . . . . . . . . . . 2 — — 86 88
Total expenses . . . . . . . . . . . . . . . . . . . . . . . . . . . . . . . . . . . . . . . . . . . . . . . . 2 — — 86 88
Income (loss) from continuing operations, before income tax benefit . . . . . . . . . . . . . . . . . . . (442) (560) (102) (86) (1,190)
Loss from discontinued operations, net of taxes . . . . . . . . . . . . . . . . . . . . . . . . . . . . . . — — — (3) (3)
Total “Core Earnings” adjustments to GAAP . . . . . . . . . . . . . . . . . . . . . . . . . . . . . . . . $(442) $(560) $(102) $(89) (1,193)
Income tax benefit . . . . . . . . . . . . . . . . . . . . . . . . . . . . . . . . . . . . . . . . . . . . . . (454)
Less: net income attributable to noncontrolling interest . . . . . . . . . . . . . . . . . . . . . . . . . . —
Net loss attributable to SLM Corporation . . . . . . . . . . . . . . . . . . . . . . . . . . . . . . . . . . $ (739)
F-103
SLM CORPORATION
NOTES TO CONSOLIDATED FINANCIAL STATEMENTS (Continued)
(Dollars in thousands, except per share amounts, unless otherwise stated)