Sallie Mae 2009 Annual Report Download - page 87
Download and view the complete annual report
Please find page 87 of the 2009 Sallie Mae annual report below. You can navigate through the pages in the report by either clicking on the pages listed below, or by using the keyword search tool below to find specific information within the annual report.-
 1
1 -
 2
2 -
 3
3 -
 4
4 -
 5
5 -
 6
6 -
 7
7 -
 8
8 -
 9
9 -
 10
10 -
 11
11 -
 12
12 -
 13
13 -
 14
14 -
 15
15 -
 16
16 -
 17
17 -
 18
18 -
 19
19 -
 20
20 -
 21
21 -
 22
22 -
 23
23 -
 24
24 -
 25
25 -
 26
26 -
 27
27 -
 28
28 -
 29
29 -
 30
30 -
 31
31 -
 32
32 -
 33
33 -
 34
34 -
 35
35 -
 36
36 -
 37
37 -
 38
38 -
 39
39 -
 40
40 -
 41
41 -
 42
42 -
 43
43 -
 44
44 -
 45
45 -
 46
46 -
 47
47 -
 48
48 -
 49
49 -
 50
50 -
 51
51 -
 52
52 -
 53
53 -
 54
54 -
 55
55 -
 56
56 -
 57
57 -
 58
58 -
 59
59 -
 60
60 -
 61
61 -
 62
62 -
 63
63 -
 64
64 -
 65
65 -
 66
66 -
 67
67 -
 68
68 -
 69
69 -
 70
70 -
 71
71 -
 72
72 -
 73
73 -
 74
74 -
 75
75 -
 76
76 -
 77
77 -
 78
78 -
 79
79 -
 80
80 -
 81
81 -
 82
82 -
 83
83 -
 84
84 -
 85
85 -
 86
86 -
 87
87 -
 88
88 -
 89
89 -
 90
90 -
 91
91 -
 92
92 -
 93
93 -
 94
94 -
 95
95 -
 96
96 -
 97
97 -
 98
98 -
 99
99 -
 100
100 -
 101
101 -
 102
102 -
 103
103 -
 104
104 -
 105
105 -
 106
106 -
 107
107 -
 108
108 -
 109
109 -
 110
110 -
 111
111 -
 112
112 -
 113
113 -
 114
114 -
 115
115 -
 116
116 -
 117
117 -
 118
118 -
 119
119 -
 120
120 -
 121
121 -
 122
122 -
 123
123 -
 124
124 -
 125
125 -
 126
126 -
 127
127 -
 128
128 -
 129
129 -
 130
130 -
 131
131 -
 132
132 -
 133
133 -
 134
134 -
 135
135 -
 136
136 -
 137
137 -
 138
138 -
 139
139 -
 140
140 -
 141
141 -
 142
142 -
 143
143 -
 144
144 -
 145
145 -
 146
146 -
 147
147 -
 148
148 -
 149
149 -
 150
150 -
 151
151 -
 152
152 -
 153
153 -
 154
154 -
 155
155 -
 156
156 -
 157
157 -
 158
158 -
 159
159 -
 160
160 -
 161
161 -
 162
162 -
 163
163 -
 164
164 -
 165
165 -
 166
166 -
 167
167 -
 168
168 -
 169
169 -
 170
170 -
 171
171 -
 172
172 -
 173
173 -
 174
174 -
 175
175 -
 176
176 -
 177
177 -
 178
178 -
 179
179 -
 180
180 -
 181
181 -
 182
182 -
 183
183 -
 184
184 -
 185
185 -
 186
186 -
 187
187 -
 188
188 -
 189
189 -
 190
190 -
 191
191 -
 192
192 -
 193
193 -
 194
194 -
 195
195 -
 196
196 -
 197
197 -
 198
198 -
 199
199 -
 200
200 -
 201
201 -
 202
202 -
 203
203 -
 204
204 -
 205
205 -
 206
206 -
 207
207 -
 208
208 -
 209
209 -
 210
210 -
 211
211 -
 212
212 -
 213
213 -
 214
214 -
 215
215 -
 216
216 -
 217
217 -
 218
218 -
 219
219 -
 220
220 -
 221
221 -
 222
222 -
 223
223 -
 224
224 -
 225
225 -
 226
226 -
 227
227 -
 228
228 -
 229
229 -
 230
230 -
 231
231 -
 232
232 -
 233
233 -
 234
234 -
 235
235 -
 236
236 -
 237
237 -
 238
238 -
 239
239 -
 240
240 -
 241
241 -
 242
242 -
 243
243 -
 244
244 -
 245
245 -
 246
246 -
 247
247 -
 248
248 -
 249
249 -
 250
250 -
 251
251 -
 252
252 -
 253
253 -
 254
254 -
 255
255 -
 256
256
 |
 |

ASSET PERFORMANCE GROUP (“APG”) BUSINESS SEGMENT
In our APG business segment, we provide a wide range of accounts receivable and collections services,
including student loan default aversion services, defaulted student loan portfolio management services,
contingency collections services for student loans and other asset classes, and accounts receivable management
and collection for purchased portfolios of receivables that are delinquent or have been charged off by their
original creditors as well as sub-performing and non-performing mortgage loans. In the purchased receivables
business, we focus on a variety of consumer debt types with emphasis on charged off credit card receivables
and distressed mortgage receivables. We purchase these portfolios at a discount to their face value and then
use both our internal collection operations, coupled with third-party collection agencies, to maximize the
recovery on these receivables.
An overview of this segment and recent developments that have significantly impacted this segment are
included in the “Item 1. Business” section of this document. The private sector collections industry is highly
fragmented with few large public companies and a large number of small scale privately-held companies. The
collections industry is highly competitive. We are responding to these competitive challenges through enhanced
servicing efficiencies and by continuing to build on customer relationships through value added services and
financings.
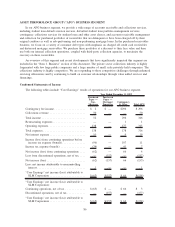
Condensed Statements of Income
The following tables include “Core Earnings” results of operations for our APG business segment.
Purchased
Paper —
Non-
Mortgage
Purchased
Paper —
Mortgage/
Properties
Contingency
& Other Total APG
Year Ended December 31, 2009
Contingency fee income .................... $ 2 $ — $294 $ 296
Collections revenue ....................... 50 — — 50
Total income ............................ 52 294 346
Restructuring expenses ..................... — — 1 1
Operating expenses........................ 138 — 177 315
Total expenses ........................... 138 178 316
Net interest expense ....................... 10 — 9 19
Income (loss) from continuing operations before
income tax expense (benefit) . . . ............ (96) — 107 11
Income tax expense (benefit) ................ (34) — 41 7
Net income (loss) from continuing operations .... (62) — 66 4
Loss from discontinued operations, net of tax .... — (157) — (157)
Net income (loss) ......................... (62) (157) 66 (153)
Less: net income attributable to noncontrolling
interest ............................... 1 — — 1
“Core Earnings” net income (loss) attributable to
SLM Corporation ....................... $(63) $(157) $ 66 $(154)
“Core Earnings” net income (loss) attributable to
SLM Corporation:
Continuing operations, net of tax . ............ $(63) $ — $ 66 $ 3
Discontinued operations, net of tax ............ — (157) — (157)
“Core Earnings” net income (loss) attributable to
SLM Corporation ....................... $(63) $(157) $ 66 $(154)
86
