Sallie Mae 2009 Annual Report Download - page 41
Download and view the complete annual report
Please find page 41 of the 2009 Sallie Mae annual report below. You can navigate through the pages in the report by either clicking on the pages listed below, or by using the keyword search tool below to find specific information within the annual report.-
 1
1 -
2
-
3
-
4
-
5
-
6
-
7
-
8
-
9
-
10
-
11
-
12
-
13
-
14
-
15
-
16
-
17
-
18
-
19
-
20
-
21
-
22
-
23
-
24
-
25
-
26
-
27
-
28
-
29
-
30
-
 31
31 -
 32
32 -
 33
33 -
 34
34 -
 35
35 -
 36
36 -
 37
37 -
 38
38 -
 39
39 -
 40
40 -
 41
41 -
 42
42 -
 43
43 -
 44
44 -
 45
45 -
 46
46 -
 47
47 -
 48
48 -
 49
49 -
 50
50 -
 51
51 -
52
-
53
-
54
-
55
-
56
-
57
-
58
-
59
-
60
-
61
-
62
-
63
-
64
-
65
-
66
-
67
-
68
-
69
-
70
-
71
-
72
-
73
-
74
-
75
-
76
-
77
-
78
-
79
-
80
-
81
-
82
-
83
-
84
-
85
-
86
-
87
-
88
-
89
-
90
-
91
-
92
-
93
-
94
-
95
-
96
-
97
-
98
-
99
-
100
-
101
-
102
-
103
-
104
-
105
-
106
-
107
-
108
-
109
-
110
-
111
-
112
-
113
-
114
-
115
-
116
-
117
-
118
-
119
-
120
-
121
-
122
-
123
-
124
-
125
-
126
-
127
-
128
-
129
-
130
-
131
-
132
-
133
-
134
-
135
-
136
-
137
-
138
-
139
-
140
-
141
-
142
-
143
-
144
-
145
-
146
-
147
-
148
-
149
-
150
-
151
-
152
-
153
-
154
-
155
-
156
-
157
-
158
-
159
-
160
-
161
-
162
-
163
-
164
-
165
-
166
-
167
-
168
-
169
-
170
-
171
-
172
-
173
-
174
-
175
-
176
-
177
-
178
-
179
-
180
-
181
-
182
-
183
-
184
-
185
-
186
-
187
-
188
-
189
-
190
-
191
-
192
-
193
-
194
-
195
-
196
-
197
-
198
-
199
-
200
-
201
-
202
-
203
-
204
-
205
-
206
-
207
-
208
-
209
-
210
-
211
-
212
-
213
-
214
-
215
-
216
-
217
-
218
-
219
-
220
-
221
-
222
-
223
-
224
-
225
-
226
-
227
-
228
-
229
-
230
-
231
-
232
-
233
-
234
-
235
-
236
-
237
-
238
-
239
-
240
-
241
-
242
-
243
-
244
-
245
-
246
-
247
-
248
-
249
-
250
-
251
-
252
-
253
-
254
-
255
-
256
 |
 |
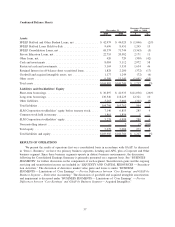
stock through the mandatory conversion date. The accounting treatment for this conversion resulted in
additional expense recorded as a part of preferred stock dividends for the period of approximately $53 million.
Net loss attributable to SLM Corporation from discontinued operations was $158 million for the year
ended December 31, 2009 compared to $143 million for the prior year. As discussed above, the Company sold
all of the assets in its Purchased Paper — Mortgage/Properties business in the fourth quarter of 2009 which
resulted in an after-tax loss of $95 million. In the year ended December 31, 2009, the Company incurred
$154 million of after-tax asset impairments associated with this business line compared to the prior year,
during which the Company incurred $161 million of after-tax asset impairments.
Year Ended December 31, 2008 Compared to Year Ended December 31, 2007
For the year ended December 31, 2008, our net loss attributable to SLM Corporation was $213 million,
or $.69 diluted loss per share attributable to SLM Corporation common shareholders, compared to a net loss
of $896 million, or $2.26 diluted loss per share attributable to SLM Corporation common shareholders, for the
year December 31, 2007. For the year ended December 31, 2008, net loss attributable to SLM Corporation
from continuing operations was $70 million, or $.39 diluted earnings from continuing operations per common
share attributable to SLM Corporation common shareholders, compared to a net loss from continuing
operations of $902 million, or $2.28 diluted loss from continuing operations per common share attributable to
SLM Corporation common shareholders, for year ended December 31, 2007. For the year ended December 31,
2008, net loss attributable to SLM Corporation from discontinued operations was $143 million, or $.30 diluted
loss from discontinued operations per common share attributable to SLM Corporation common shareholders,
compared to a net income from discontinued operations of $6 million, or $.02 diluted earnings from
discontinued operations per common share attributable to SLM Corporation common shareholders, for the year
ended December 31, 2007.
Pre-tax loss from continuing operations decreased by $350 million versus 2007 primarily due to a
decrease in net losses on derivative and hedging activities from $1.4 billion for the year ended December 31,
2007 to $445 million for the year ended December 31, 2008, which was primarily a result of the
mark-to-market on the equity forward contracts in the fourth quarter of 2007. This increase in income was
partially offset by a $367 million decrease in gains on student loan securitizations and a $175 million decrease
in servicing and securitization revenue.
There were no gains on student loan securitizations in the year ended December 31, 2008, compared to
gains of $367 million in the year-ago period. We did not complete any off-balance sheet securitizations in the
year ended December 31, 2008, versus one Private Education Loan securitization in 2007. In accordance with
ASC 825, “Financial Instruments,” we elected the fair value option on all of the Residual Interests effective
January 1, 2008. We made this election in order to simplify the accounting for Residual Interests by having all
Residual Interests under one accounting model. Prior to this election, Residual Interests were accounted for
either with changes in fair value recorded through other comprehensive income or with changes in fair value
recorded through income. We reclassified the related accumulated other comprehensive income of $195 million
into retained earnings and as a result equity was not impacted at transition on January 1, 2008. Changes in fair
value of Residual Interests on and after January 1, 2008 are recorded through servicing and securitization
income. We have not elected the fair value option for any other financial instruments at this time. Servicing
and securitization revenue decreased by $175 million from $437 million in the year ended December 31, 2007
to $262 million in the year ended December 31, 2008. This decrease was primarily due to a $425 million
unrealized mark-to-market loss recorded in 2008 compared to a $278 million unrealized mark-to-market loss
in the prior year, which included both impairment and an unrealized mark-to-market gain recorded under ASC
815-15, “Embedded Derivatives”. The increase in the unrealized mark-to-market loss in 2008 versus 2007 was
primarily due to increases in the discount rates used to value the Residual Interests. See “LIQUIDITY AND
CAPITAL RESOURCES — Securitization Activities — Residual Interest in Securitized Receivables” for
further discussion of the factors impacting the fair values.
40