Sallie Mae 2009 Annual Report Download - page 139
Download and view the complete annual report
Please find page 139 of the 2009 Sallie Mae annual report below. You can navigate through the pages in the report by either clicking on the pages listed below, or by using the keyword search tool below to find specific information within the annual report.-
 1
1 -
2
-
3
-
4
-
5
-
6
-
7
-
8
-
9
-
10
-
11
-
12
-
13
-
14
-
15
-
16
-
17
-
18
-
19
-
20
-
21
-
22
-
23
-
24
-
25
-
26
-
27
-
28
-
29
-
30
-
31
-
32
-
33
-
34
-
35
-
36
-
37
-
38
-
39
-
40
-
41
-
42
-
43
-
44
-
45
-
46
-
47
-
48
-
49
-
50
-
51
-
52
-
53
-
54
-
55
-
56
-
57
-
58
-
59
-
60
-
61
-
62
-
63
-
64
-
65
-
66
-
67
-
68
-
69
-
70
-
71
-
72
-
73
-
74
-
75
-
76
-
77
-
78
-
79
-
80
-
81
-
82
-
83
-
84
-
85
-
86
-
87
-
88
-
89
-
90
-
91
-
92
-
93
-
94
-
95
-
96
-
97
-
98
-
99
-
100
-
101
-
102
-
103
-
104
-
105
-
106
-
107
-
108
-
109
-
110
-
111
-
112
-
113
-
114
-
115
-
116
-
117
-
118
-
119
-
120
-
121
-
122
-
123
-
124
-
125
-
126
-
127
-
128
-
 129
129 -
 130
130 -
 131
131 -
 132
132 -
 133
133 -
 134
134 -
 135
135 -
 136
136 -
 137
137 -
 138
138 -
 139
139 -
 140
140 -
 141
141 -
 142
142 -
 143
143 -
 144
144 -
 145
145 -
 146
146 -
 147
147 -
 148
148 -
 149
149 -
150
-
151
-
152
-
153
-
154
-
155
-
156
-
157
-
158
-
159
-
160
-
161
-
162
-
163
-
164
-
165
-
166
-
167
-
168
-
169
-
170
-
171
-
172
-
173
-
174
-
175
-
176
-
177
-
178
-
179
-
180
-
181
-
182
-
183
-
184
-
185
-
186
-
187
-
188
-
189
-
190
-
191
-
192
-
193
-
194
-
195
-
196
-
197
-
198
-
199
-
200
-
201
-
202
-
203
-
204
-
205
-
206
-
207
-
208
-
209
-
210
-
211
-
212
-
213
-
214
-
215
-
216
-
217
-
218
-
219
-
220
-
221
-
222
-
223
-
224
-
225
-
226
-
227
-
228
-
229
-
230
-
231
-
232
-
233
-
234
-
235
-
236
-
237
-
238
-
239
-
240
-
241
-
242
-
243
-
244
-
245
-
246
-
247
-
248
-
249
-
250
-
251
-
252
-
253
-
254
-
255
-
256
 |
 |
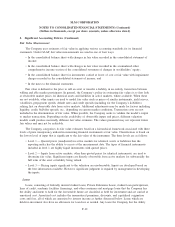
2. Significant Accounting Policies (Continued)
Fair Value Measurement
The Company uses estimates of fair value in applying various accounting standards for its financial
statements. Under GAAP, fair value measurements are used in one of four ways:
• In the consolidated balance sheet with changes in fair value recorded in the consolidated statement of
income;
• In the consolidated balance sheet with changes in fair value recorded in the accumulated other
comprehensive income section of the consolidated statement of changes in stockholders’ equity;
• In the consolidated balance sheet for instruments carried at lower of cost or fair value with impairment
charges recorded in the consolidated statement of income; and
• In the notes to the financial statements.
Fair value is defined as the price to sell an asset or transfer a liability in an orderly transaction between
willing and able market participants. In general, the Company’s policy in estimating fair values is to first look
at observable market prices for identical assets and liabilities in active markets, where available. When these
are not available, other inputs are used to model fair value such as prices of similar instruments, yield curves,
volatilities, prepayment speeds, default rates and credit spreads (including for the Company’s liabilities),
relying first on observable data from active markets. Additional adjustments may be made for factors including
liquidity, credit, bid/offer spreads, etc., depending on current market conditions. Transaction costs are not
included in the determination of fair value. When possible, the Company seeks to validate the model’s output
to market transactions. Depending on the availability of observable inputs and prices, different valuation
models could produce materially different fair value estimates. The values presented may not represent future
fair values and may not be realizable.
The Company categorizes its fair value estimates based on a hierarchical framework associated with three
levels of price transparency utilized in measuring financial instruments at fair value. Classification is based on
the lowest level of input that is significant to the fair value of the instrument. The three levels are as follows:
• Level 1 — Quoted prices (unadjusted) in active markets for identical assets or liabilities that the
reporting entity has the ability to access at the measurement date. The types of financial instruments
included in level 1 are highly liquid instruments with quoted prices.
• Level 2 — Inputs from active markets, other than quoted prices for identical instruments, are used to
determine fair value. Significant inputs are directly observable from active markets for substantially the
full term of the asset or liability being valued.
• Level 3 — Pricing inputs significant to the valuation are unobservable. Inputs are developed based on
the best information available. However, significant judgment is required by management in developing
the inputs.
Loans
Loans, consisting of federally insured student loans, Private Education Loans, student loan participations,
lines of credit, academic facilities financings, and other consumer and mortgage loans that the Company has
the ability and intent to hold for the foreseeable future are classified as held for investment and are carried at
amortized cost. Amortized cost includes the unamortized premiums, discounts, and capitalized origination
costs and fees, all of which are amortized to interest income as further discussed below. Loans which are
held-for-investment also have an allowance for loan loss as needed. Any loans the Company has the ability
F-12
SLM CORPORATION
NOTES TO CONSOLIDATED FINANCIAL STATEMENTS (Continued)
(Dollars in thousands, except per share amounts, unless otherwise stated)