Sallie Mae 2009 Annual Report Download - page 165
Download and view the complete annual report
Please find page 165 of the 2009 Sallie Mae annual report below. You can navigate through the pages in the report by either clicking on the pages listed below, or by using the keyword search tool below to find specific information within the annual report.-
 1
1 -
2
-
3
-
4
-
5
-
6
-
7
-
8
-
9
-
10
-
11
-
12
-
13
-
14
-
15
-
16
-
17
-
18
-
19
-
20
-
21
-
22
-
23
-
24
-
25
-
26
-
27
-
28
-
29
-
30
-
31
-
32
-
33
-
34
-
35
-
36
-
37
-
38
-
39
-
40
-
41
-
42
-
43
-
44
-
45
-
46
-
47
-
48
-
49
-
50
-
51
-
52
-
53
-
54
-
55
-
56
-
57
-
58
-
59
-
60
-
61
-
62
-
63
-
64
-
65
-
66
-
67
-
68
-
69
-
70
-
71
-
72
-
73
-
74
-
75
-
76
-
77
-
78
-
79
-
80
-
81
-
82
-
83
-
84
-
85
-
86
-
87
-
88
-
89
-
90
-
91
-
92
-
93
-
94
-
95
-
96
-
97
-
98
-
99
-
100
-
101
-
102
-
103
-
104
-
105
-
106
-
107
-
108
-
109
-
110
-
111
-
112
-
113
-
114
-
115
-
116
-
117
-
118
-
119
-
120
-
121
-
122
-
123
-
124
-
125
-
126
-
127
-
128
-
129
-
130
-
131
-
132
-
133
-
134
-
135
-
136
-
137
-
138
-
139
-
140
-
141
-
142
-
143
-
144
-
145
-
146
-
147
-
148
-
149
-
150
-
151
-
152
-
153
-
154
-
 155
155 -
 156
156 -
 157
157 -
 158
158 -
 159
159 -
 160
160 -
 161
161 -
 162
162 -
 163
163 -
 164
164 -
 165
165 -
 166
166 -
 167
167 -
 168
168 -
 169
169 -
 170
170 -
 171
171 -
 172
172 -
 173
173 -
 174
174 -
 175
175 -
176
-
177
-
178
-
179
-
180
-
181
-
182
-
183
-
184
-
185
-
186
-
187
-
188
-
189
-
190
-
191
-
192
-
193
-
194
-
195
-
196
-
197
-
198
-
199
-
200
-
201
-
202
-
203
-
204
-
205
-
206
-
207
-
208
-
209
-
210
-
211
-
212
-
213
-
214
-
215
-
216
-
217
-
218
-
219
-
220
-
221
-
222
-
223
-
224
-
225
-
226
-
227
-
228
-
229
-
230
-
231
-
232
-
233
-
234
-
235
-
236
-
237
-
238
-
239
-
240
-
241
-
242
-
243
-
244
-
245
-
246
-
247
-
248
-
249
-
250
-
251
-
252
-
253
-
254
-
255
-
256
 |
 |

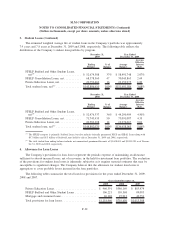
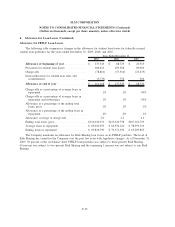
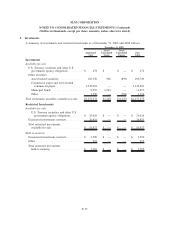
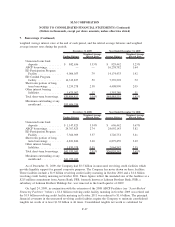
5. Investments (Continued)
Amortized
Cost
Gross
Unrealized
Gains
Gross
Unrealized
Losses
Fair
Value
December 31, 2008
Investments
Available-for-sale
U.S. Treasury and other U.S. government
agency obligations:
U.S. Treasury securities and other U.S.
government agency obligations .......... $ 8,908 $ 195 $ — $ 9,103
Other securities:
Asset-backed securities ................. 40,907 13 (4,299) 36,621
Commercial paper and asset-backed
commercial paper ................... 801,169 — — 801,169
Municipal bonds ...................... 10,883 1,924 — 12,807
Other .............................. 1,673 — (365) 1,308
Total investment securities available-for-sale ..... $863,540 $2,132 $(4,664) $861,008
Restricted Investments
Available-for-sale
Guaranteed investment contracts ............ $ 31,914 $ — $ — $ 31,914
Total restricted investments available-for-sale . . . $ 31,914 $ — $ — $ 31,914
Held-to-maturity
Guaranteed investment contracts ............ $ 5,500 $ — $ — $ 5,500
Other securities ......................... 215 — — 215
Total restricted investments held-to-maturity ..... $ 5,715 $ — $ — $ 5,715
In addition to the restricted investments detailed above, at December 31, 2009 and 2008, the Company
had restricted cash of $5.1 billion and $3.5 billion, respectively.
As of December 31, 2009 and 2008, $1 million and $2 million of the net unrealized gain/(loss) (after tax)
related to available-for-sale investments was included in accumulated other comprehensive income. As of
December 31, 2009 and 2008, $50 million ($25 million of which is in restricted cash and investments on the
balance sheet) and $26 million (none of which is in restricted cash and investments on the balance sheet),
respectively, of available-for-sale investment securities were pledged as collateral.
The Company sold available-for-sale securities with a fair value of $100 million, $457 million and
$73 million for the years ended December 31, 2009, 2008, and 2007, respectively. There were no realized
gains/(losses) for the years ended December 31, 2009 and 2007. There were $14 million in realized gains (net
of hedging losses totaling $4 million) for the year ended December 31, 2008. The cost basis for these
securities was determined through specific identification of the securities sold.
F-38
SLM CORPORATION
NOTES TO CONSOLIDATED FINANCIAL STATEMENTS (Continued)
(Dollars in thousands, except per share amounts, unless otherwise stated)