Sallie Mae 2009 Annual Report Download - page 60
Download and view the complete annual report
Please find page 60 of the 2009 Sallie Mae annual report below. You can navigate through the pages in the report by either clicking on the pages listed below, or by using the keyword search tool below to find specific information within the annual report.-
 1
1 -
2
-
3
-
4
-
5
-
6
-
7
-
8
-
9
-
10
-
11
-
12
-
13
-
14
-
15
-
16
-
17
-
18
-
19
-
20
-
21
-
22
-
23
-
24
-
25
-
26
-
27
-
28
-
29
-
30
-
31
-
32
-
33
-
34
-
35
-
36
-
37
-
38
-
39
-
40
-
41
-
42
-
43
-
44
-
45
-
46
-
47
-
48
-
49
-
 50
50 -
 51
51 -
 52
52 -
 53
53 -
 54
54 -
 55
55 -
 56
56 -
 57
57 -
 58
58 -
 59
59 -
 60
60 -
 61
61 -
 62
62 -
 63
63 -
 64
64 -
 65
65 -
 66
66 -
 67
67 -
 68
68 -
 69
69 -
 70
70 -
71
-
72
-
73
-
74
-
75
-
76
-
77
-
78
-
79
-
80
-
81
-
82
-
83
-
84
-
85
-
86
-
87
-
88
-
89
-
90
-
91
-
92
-
93
-
94
-
95
-
96
-
97
-
98
-
99
-
100
-
101
-
102
-
103
-
104
-
105
-
106
-
107
-
108
-
109
-
110
-
111
-
112
-
113
-
114
-
115
-
116
-
117
-
118
-
119
-
120
-
121
-
122
-
123
-
124
-
125
-
126
-
127
-
128
-
129
-
130
-
131
-
132
-
133
-
134
-
135
-
136
-
137
-
138
-
139
-
140
-
141
-
142
-
143
-
144
-
145
-
146
-
147
-
148
-
149
-
150
-
151
-
152
-
153
-
154
-
155
-
156
-
157
-
158
-
159
-
160
-
161
-
162
-
163
-
164
-
165
-
166
-
167
-
168
-
169
-
170
-
171
-
172
-
173
-
174
-
175
-
176
-
177
-
178
-
179
-
180
-
181
-
182
-
183
-
184
-
185
-
186
-
187
-
188
-
189
-
190
-
191
-
192
-
193
-
194
-
195
-
196
-
197
-
198
-
199
-
200
-
201
-
202
-
203
-
204
-
205
-
206
-
207
-
208
-
209
-
210
-
211
-
212
-
213
-
214
-
215
-
216
-
217
-
218
-
219
-
220
-
221
-
222
-
223
-
224
-
225
-
226
-
227
-
228
-
229
-
230
-
231
-
232
-
233
-
234
-
235
-
236
-
237
-
238
-
239
-
240
-
241
-
242
-
243
-
244
-
245
-
246
-
247
-
248
-
249
-
250
-
251
-
252
-
253
-
254
-
255
-
256
 |
 |

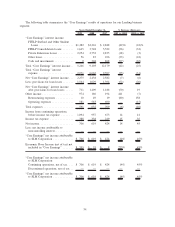
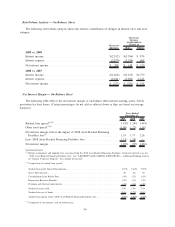
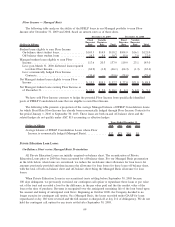
The following table reflects the “Core Earnings” net interest margin, before provisions for loan losses.
(Certain percentages do not add or subtract down as they are based on average balances.)
2009 2008 2007
Years Ended December 31,
“Core Earnings” basis student loan spread
(1)
:
FFELP loan spread ........................................... .63% .83% .96%
Private Education Loan spread
(2)
................................. 4.54 5.09 5.12
Total “Core Earnings” basis student loan spread
(3)
.................... 1.39 1.63 1.67
“Core Earnings” basis other asset spread
(1)(4)
........................ (.93) (.51) (.11)
“Core Earnings” net interest margin, before 2008 Asset-Backed Financing
Facilities fees
(1)
........................................... 1.25 1.49 1.49
Less: 2008 Asset-Backed Financing Facilities fees.................... (.11) (.19) —
“Core Earnings” net interest margin
(5)
............................. 1.14% 1.30% 1.49%
(1)
Before commitment and liquidity fees associated with the 2008 Asset-Backed Financing Facilities, which are referred to as
the “2008 Asset-Backed Financing Facilities fees” (see “LIQUIDITY AND CAPITAL RESOURCES — Additional Funding
Sources for General Corporate Purposes” for a further discussion).
(2)
“Core Earnings” basis Private Education Loan Spread, before 2008 Asset-Backed
Financing Facilities fees and after provision for loan losses . ............... .66% 2.41% .41%
(3)
Composition of “Core Earnings” basis student loan spread:
“Core Earnings” basis student loan yield . . . ......................... 3.43% 5.77% 8.12%
Consolidation Loan Rebate Fees . . . .............................. (.47) (.52) (.57)
Repayment Borrower Benefits ................................... (.09) (.11) (.11)
Premium and discount amortization . .............................. (.09) (.14) (.17)
“Core Earnings” basis student loan net yield ......................... 2.78 5.00 7.27
“Core Earnings” basis student loan cost of funds . . . .................... (1.39) (3.37) (5.60)
“Core Earnings” basis student loan spread, before 2008 Asset-Backed Financing
Facilities fees . ............................................. 1.39% 1.63% 1.67%
(4)
Comprised of investments, cash and other loans
(5)
The average balances of our Managed interest-earning assets for the respective
periods are:
FFELP loans . ............................................. $150,059 $141,647 $127,940
Private Education Loans ....................................... 36,046 32,597 26,190
Total student loans . . ........................................ 186,105 174,244 154,130
Other interest-earning assets . ................................... 12,897 12,403 17,455
Total Managed interest-earning assets .............................. $199,002 $186,647 $171,585
“Core Earnings” Basis Student Loan Spread
The “Core Earnings” basis student loan spread, before the 2008 Asset-Backed Financing Facilities fees,
for 2009 decreased 24 basis points from 2008. The “Core Earnings” basis student loan spread was negatively
impacted primarily by a 18 basis point widening of the CP/LIBOR spread, higher credit spreads on the
Company’s ABS debt issued in 2008 and 2009 due to the current credit environment and lower spreads earned
on FFELP loans funded through the ED Participation Program. Partially offsetting these decreases to the
student loan spread are lower cost of funds related to the ED Conduit Program (See “LIQUIDITY AND
CAPITAL RESOURCES — ED Funding Programs”) and higher asset spreads earned on Private Education
Loans originated during 2009 compared to prior years.
59