Sallie Mae 2009 Annual Report Download - page 82
Download and view the complete annual report
Please find page 82 of the 2009 Sallie Mae annual report below. You can navigate through the pages in the report by either clicking on the pages listed below, or by using the keyword search tool below to find specific information within the annual report.-
 1
1 -
2
-
3
-
4
-
5
-
6
-
7
-
8
-
9
-
10
-
11
-
12
-
13
-
14
-
15
-
16
-
17
-
18
-
19
-
20
-
21
-
22
-
23
-
24
-
25
-
26
-
27
-
28
-
29
-
30
-
31
-
32
-
33
-
34
-
35
-
36
-
37
-
38
-
39
-
40
-
41
-
42
-
43
-
44
-
45
-
46
-
47
-
48
-
49
-
50
-
51
-
52
-
53
-
54
-
55
-
56
-
57
-
58
-
59
-
60
-
61
-
62
-
63
-
64
-
65
-
66
-
67
-
68
-
69
-
70
-
71
-
 72
72 -
 73
73 -
 74
74 -
 75
75 -
 76
76 -
 77
77 -
 78
78 -
 79
79 -
 80
80 -
 81
81 -
 82
82 -
 83
83 -
 84
84 -
 85
85 -
 86
86 -
 87
87 -
 88
88 -
 89
89 -
 90
90 -
 91
91 -
 92
92 -
93
-
94
-
95
-
96
-
97
-
98
-
99
-
100
-
101
-
102
-
103
-
104
-
105
-
106
-
107
-
108
-
109
-
110
-
111
-
112
-
113
-
114
-
115
-
116
-
117
-
118
-
119
-
120
-
121
-
122
-
123
-
124
-
125
-
126
-
127
-
128
-
129
-
130
-
131
-
132
-
133
-
134
-
135
-
136
-
137
-
138
-
139
-
140
-
141
-
142
-
143
-
144
-
145
-
146
-
147
-
148
-
149
-
150
-
151
-
152
-
153
-
154
-
155
-
156
-
157
-
158
-
159
-
160
-
161
-
162
-
163
-
164
-
165
-
166
-
167
-
168
-
169
-
170
-
171
-
172
-
173
-
174
-
175
-
176
-
177
-
178
-
179
-
180
-
181
-
182
-
183
-
184
-
185
-
186
-
187
-
188
-
189
-
190
-
191
-
192
-
193
-
194
-
195
-
196
-
197
-
198
-
199
-
200
-
201
-
202
-
203
-
204
-
205
-
206
-
207
-
208
-
209
-
210
-
211
-
212
-
213
-
214
-
215
-
216
-
217
-
218
-
219
-
220
-
221
-
222
-
223
-
224
-
225
-
226
-
227
-
228
-
229
-
230
-
231
-
232
-
233
-
234
-
235
-
236
-
237
-
238
-
239
-
240
-
241
-
242
-
243
-
244
-
245
-
246
-
247
-
248
-
249
-
250
-
251
-
252
-
253
-
254
-
255
-
256
 |
 |

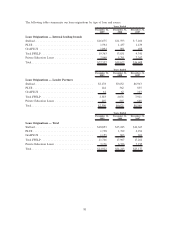
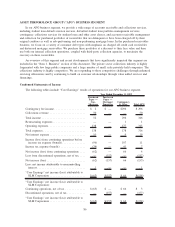
The following tables summarize our loan originations by type of loan and source.
December 31,
2009
December 31,
2008
December 31,
2007
Years Ended
Loan Originations — Internal lending brands
Stafford..................................... $16,675 $11,593 $ 7,404
PLUS ...................................... 1,594 1,437 1,439
GradPLUS .................................. 1,094 801 498
Total FFELP ................................. 19,363 13,831 9,341
Private Education Loans ........................ 2,969 5,791 7,267
Total ....................................... $22,332 $19,622 $16,608
December 31,
2009
December 31,
2008
December 31,
2007
Years Ended
Loan Originations — Lender Partners
Stafford..................................... $2,178 $3,652 $6,963
PLUS ...................................... 144 362 855
GradPLUS .................................. 61 62 103
Total FFELP ................................. 2,383 4,076 7,921
Private Education Loans ........................ 207 545 648
Total ....................................... $2,590 $4,621 $8,569
December 31,
2009
December 31,
2008
December 31,
2007
Years Ended
Loan Originations — Total
Stafford..................................... $18,853 $15,245 $14,367
PLUS ...................................... 1,738 1,799 2,294
GradPLUS .................................. 1,155 863 601
Total FFELP ................................. 21,746 17,907 17,262
Private Education Loans ........................ 3,176 6,336 7,915
Total ....................................... $24,922 $24,243 $25,177
81