Sallie Mae 2009 Annual Report Download - page 46
Download and view the complete annual report
Please find page 46 of the 2009 Sallie Mae annual report below. You can navigate through the pages in the report by either clicking on the pages listed below, or by using the keyword search tool below to find specific information within the annual report.-
 1
1 -
2
-
3
-
4
-
5
-
6
-
7
-
8
-
9
-
10
-
11
-
12
-
13
-
14
-
15
-
16
-
17
-
18
-
19
-
20
-
21
-
22
-
23
-
24
-
25
-
26
-
27
-
28
-
29
-
30
-
31
-
32
-
33
-
34
-
35
-
 36
36 -
 37
37 -
 38
38 -
 39
39 -
 40
40 -
 41
41 -
 42
42 -
 43
43 -
 44
44 -
 45
45 -
 46
46 -
 47
47 -
 48
48 -
 49
49 -
 50
50 -
 51
51 -
 52
52 -
 53
53 -
 54
54 -
 55
55 -
 56
56 -
57
-
58
-
59
-
60
-
61
-
62
-
63
-
64
-
65
-
66
-
67
-
68
-
69
-
70
-
71
-
72
-
73
-
74
-
75
-
76
-
77
-
78
-
79
-
80
-
81
-
82
-
83
-
84
-
85
-
86
-
87
-
88
-
89
-
90
-
91
-
92
-
93
-
94
-
95
-
96
-
97
-
98
-
99
-
100
-
101
-
102
-
103
-
104
-
105
-
106
-
107
-
108
-
109
-
110
-
111
-
112
-
113
-
114
-
115
-
116
-
117
-
118
-
119
-
120
-
121
-
122
-
123
-
124
-
125
-
126
-
127
-
128
-
129
-
130
-
131
-
132
-
133
-
134
-
135
-
136
-
137
-
138
-
139
-
140
-
141
-
142
-
143
-
144
-
145
-
146
-
147
-
148
-
149
-
150
-
151
-
152
-
153
-
154
-
155
-
156
-
157
-
158
-
159
-
160
-
161
-
162
-
163
-
164
-
165
-
166
-
167
-
168
-
169
-
170
-
171
-
172
-
173
-
174
-
175
-
176
-
177
-
178
-
179
-
180
-
181
-
182
-
183
-
184
-
185
-
186
-
187
-
188
-
189
-
190
-
191
-
192
-
193
-
194
-
195
-
196
-
197
-
198
-
199
-
200
-
201
-
202
-
203
-
204
-
205
-
206
-
207
-
208
-
209
-
210
-
211
-
212
-
213
-
214
-
215
-
216
-
217
-
218
-
219
-
220
-
221
-
222
-
223
-
224
-
225
-
226
-
227
-
228
-
229
-
230
-
231
-
232
-
233
-
234
-
235
-
236
-
237
-
238
-
239
-
240
-
241
-
242
-
243
-
244
-
245
-
246
-
247
-
248
-
249
-
250
-
251
-
252
-
253
-
254
-
255
-
256
 |
 |

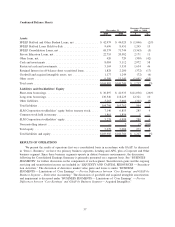
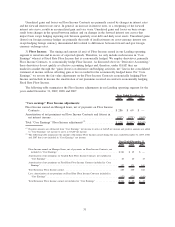
Lending APG
Corporate
and Other
Year Ended
December 31, 2008
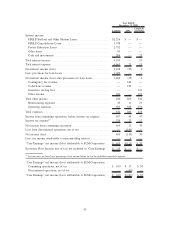
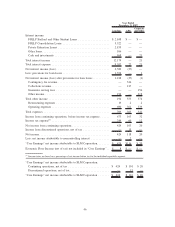
Interest income:
FFELP Stafford and Other Student Loans..................... $2,216 $ — $ —
FFELP Consolidation Loans .............................. 3,748 — —
Private Education Loans ................................. 2,752 — —
Other loans ........................................... 83 — —
Cash and investments ................................... 304 — 25
Total interest income ...................................... 9,103 — 25
Total interest expense ..................................... 6,665 25 19
Net interest income (loss) .................................. 2,438 (25) 6
Less: provisions for loan losses .............................. 1,029 — —
Net interest income (loss) after provisions for loan losses ........... 1,409 (25) 6
Contingency fee revenue ................................. — 340 —
Collections revenue ..................................... — 129 —
Guarantor serving fees ................................... — — 121
Other income ......................................... 180 — 199
Total other income ....................................... 180 469 320
Restructuring expenses .................................. 49 11 23
Operating expenses ..................................... 583 389 256
Total expenses .......................................... 632 400 279
Income from continuing operations, before income tax expense ...... 957 44 47
Income tax expense
(1)
..................................... 338 23 17
Net income from continuing operations ........................ 619 21 30
Loss from discontinued operations, net of tax ................... — (140) —
Net income (loss) ........................................ 619 (119) 30
Less: net income attributable to noncontrolling interest ............ — 4 —
“Core Earnings” net income (loss) attributable to SLM Corporation . . . $ 619 $(123) $ 30
Economic Floor Income (net of tax) not included in “Core Earnings” . . $ 55 $ — $ —
(1)
Income taxes are based on a percentage of net income before tax for the individual reportable segment.
“Core Earnings” net income (loss) attributable to SLM Corporation:
Continuing operations, net of tax ........................... $ 619 $ 17 $ 30
Discontinued operations, net of tax ......................... — (140) —
“Core Earnings” net income (loss) attributable to SLM Corporation . . . $ 619 $(123) $ 30
45