Sallie Mae 2009 Annual Report Download - page 40
Download and view the complete annual report
Please find page 40 of the 2009 Sallie Mae annual report below. You can navigate through the pages in the report by either clicking on the pages listed below, or by using the keyword search tool below to find specific information within the annual report.-
 1
1 -
2
-
3
-
4
-
5
-
6
-
7
-
8
-
9
-
10
-
11
-
12
-
13
-
14
-
15
-
16
-
17
-
18
-
19
-
20
-
21
-
22
-
23
-
24
-
25
-
26
-
27
-
28
-
29
-
 30
30 -
 31
31 -
 32
32 -
 33
33 -
 34
34 -
 35
35 -
 36
36 -
 37
37 -
 38
38 -
 39
39 -
 40
40 -
 41
41 -
 42
42 -
 43
43 -
 44
44 -
 45
45 -
 46
46 -
 47
47 -
 48
48 -
 49
49 -
 50
50 -
51
-
52
-
53
-
54
-
55
-
56
-
57
-
58
-
59
-
60
-
61
-
62
-
63
-
64
-
65
-
66
-
67
-
68
-
69
-
70
-
71
-
72
-
73
-
74
-
75
-
76
-
77
-
78
-
79
-
80
-
81
-
82
-
83
-
84
-
85
-
86
-
87
-
88
-
89
-
90
-
91
-
92
-
93
-
94
-
95
-
96
-
97
-
98
-
99
-
100
-
101
-
102
-
103
-
104
-
105
-
106
-
107
-
108
-
109
-
110
-
111
-
112
-
113
-
114
-
115
-
116
-
117
-
118
-
119
-
120
-
121
-
122
-
123
-
124
-
125
-
126
-
127
-
128
-
129
-
130
-
131
-
132
-
133
-
134
-
135
-
136
-
137
-
138
-
139
-
140
-
141
-
142
-
143
-
144
-
145
-
146
-
147
-
148
-
149
-
150
-
151
-
152
-
153
-
154
-
155
-
156
-
157
-
158
-
159
-
160
-
161
-
162
-
163
-
164
-
165
-
166
-
167
-
168
-
169
-
170
-
171
-
172
-
173
-
174
-
175
-
176
-
177
-
178
-
179
-
180
-
181
-
182
-
183
-
184
-
185
-
186
-
187
-
188
-
189
-
190
-
191
-
192
-
193
-
194
-
195
-
196
-
197
-
198
-
199
-
200
-
201
-
202
-
203
-
204
-
205
-
206
-
207
-
208
-
209
-
210
-
211
-
212
-
213
-
214
-
215
-
216
-
217
-
218
-
219
-
220
-
221
-
222
-
223
-
224
-
225
-
226
-
227
-
228
-
229
-
230
-
231
-
232
-
233
-
234
-
235
-
236
-
237
-
238
-
239
-
240
-
241
-
242
-
243
-
244
-
245
-
246
-
247
-
248
-
249
-
250
-
251
-
252
-
253
-
254
-
255
-
256
 |
 |
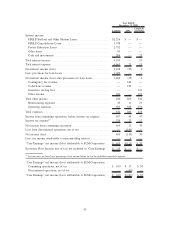
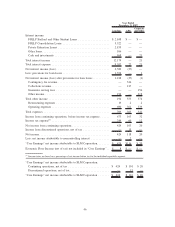
trusts that settled before September 30, 2005 became 180 days delinquent, the Company previously exercised
its contingent call option to repurchase these loans at par value out of the trusts and recorded a loss for the
difference in the par value paid and the fair market value of the loans at the time of purchase. The Company
does not hold this contingent call option for any trusts that settled after September 30, 2005. In October 2008,
the Company decided to no longer exercise its contingent call option. The loss in 2008 also relates to the sale
of approximately $1.0 billion FFELP loans to the ED under ECASLA, which resulted in a $53 million loss.
For the year ended December 31, 2009, contingency fee, collections and guarantor servicing fee revenue
totaled $483 million, a $106 million decrease from $589 million in the prior year. This decrease was primarily
due to a decline in revenue due to a significantly smaller non-mortgage purchased paper portfolio
year-over-year as a result of winding down this collections business. Total impairment in the non-mortgage
purchased paper portfolio was $79 million in 2009 compared to $111 million in 2008. The impairment is a
result of the continued impact of the economy on the ability to collect on these assets (see “ASSET
PERFORMANCE GROUP BUSINESS SEGMENT”).
In response to the College Cost Reduction and Access Act of 2007 (“CCRAA”) and challenges in the
capital markets, the Company initiated a restructuring plan in the fourth quarter of 2007. The plan focused on
conforming our lending activities to the economic environment, exiting certain customer relationships and
product lines, winding down our debt purchased paper businesses, and significantly reducing our operating
expenses. The restructuring plan is essentially completed and our objectives have been met. As part of the
Company’s cost reduction efforts, restructuring expenses of $14 million and $83 million were recognized in
continuing operations in the years ended December 31, 2009 and 2008, respectively. Restructuring expenses
from the fourth quarter of 2007 through December 31, 2009 totaled $129 million, of which $120 million was
recorded in continuing operations and $9 million was recorded in discontinued operations. The majority of
these restructuring expenses were severance costs related to the completed and planned elimination of
approximately 2,900 positions, or approximately 25 percent of the workforce. We estimate approximately
$5 million of additional restructuring expenses associated with our current cost reduction efforts will be
incurred during 2010. On September 17, 2009, the House passed SAFRA which, if signed into law, would
eliminate the FFELP and require that, after July 1, 2010, all new federal loans be made through the Direct
Loan program. The Senate has yet to take up the legislation. If this legislation is signed into law, the Company
will undertake another significant restructuring to conform its infrastructure to the elimination of the FFELP
and achieve additional expense reduction. See “OVERVIEW — Legislative and Regulatory Developments” for
a further discussion of SAFRA.
Operating expenses were $1.26 billion in the year ended December 31, 2009 compared to $1.32 billion in
the prior year. The $61 million decrease in operating expenses was primarily due to the Company’s cost
reduction efforts discussed above as well as an $11 million reduction in amortization and impairment of
acquired intangible assets. The amortization and impairment of acquired intangibles for continuing operations
totaled $75 million and $86 million for the years ended December 31, 2009 and 2008, respectively.
Income tax expense from continuing operations was $238 million in the year ended December 31, 2009
compared to income tax (benefit) of $(76) million in the prior year, resulting in effective tax rates of 33 percent
and 54 percent. The movement in the effective tax rate in 2009 compared with the prior year was primarily
driven by the reduction of tax and interest on U.S. federal and state uncertain tax positions in both periods, as
well as the permanent tax impact of deducting Proposed Merger-related transaction costs in the year ended
December 31, 2008. Also contributing to the movement was the impact of significantly higher reported pre-tax
income in 2009 and the resulting changes in the proportion of income subject to federal and state taxes. For
additional information, see Note 19, “Income Taxes,” to the consolidated financial statements.
During 2009, the Company converted $339 million of its Series C Preferred Stock to common stock. As
part of this conversion, the Company delivered to the holders of the preferred stock: (1) approximately
17 million shares (the number of common shares they would most likely receive if the preferred stock they
held mandatorily converted to common shares in the fourth quarter of 2010) plus (2) a discounted amount of
the preferred stock dividends the holders of the preferred stock would have received if they held the preferred
39