SunTrust 2013 Annual Report Download - page 96
Download and view the complete annual report
Please find page 96 of the 2013 SunTrust annual report below. You can navigate through the pages in the report by either clicking on the pages listed below, or by using the keyword search tool below to find specific information within the annual report.-
 1
1 -
2
-
3
-
4
-
5
-
6
-
7
-
8
-
9
-
10
-
11
-
12
-
13
-
14
-
15
-
16
-
17
-
18
-
19
-
20
-
21
-
22
-
23
-
24
-
25
-
26
-
27
-
28
-
29
-
30
-
31
-
32
-
33
-
34
-
35
-
36
-
37
-
38
-
39
-
40
-
41
-
42
-
43
-
44
-
45
-
46
-
47
-
48
-
49
-
50
-
51
-
52
-
53
-
54
-
55
-
56
-
57
-
58
-
59
-
60
-
61
-
62
-
63
-
64
-
65
-
66
-
67
-
68
-
69
-
70
-
71
-
72
-
73
-
74
-
75
-
76
-
77
-
78
-
79
-
80
-
81
-
82
-
83
-
84
-
85
-
 86
86 -
 87
87 -
 88
88 -
 89
89 -
 90
90 -
 91
91 -
 92
92 -
 93
93 -
 94
94 -
 95
95 -
 96
96 -
 97
97 -
 98
98 -
 99
99 -
 100
100 -
 101
101 -
 102
102 -
 103
103 -
 104
104 -
 105
105 -
 106
106 -
107
-
108
-
109
-
110
-
111
-
112
-
113
-
114
-
115
-
116
-
117
-
118
-
119
-
120
-
121
-
122
-
123
-
124
-
125
-
126
-
127
-
128
-
129
-
130
-
131
-
132
-
133
-
134
-
135
-
136
-
137
-
138
-
139
-
140
-
141
-
142
-
143
-
144
-
145
-
146
-
147
-
148
-
149
-
150
-
151
-
152
-
153
-
154
-
155
-
156
-
157
-
158
-
159
-
160
-
161
-
162
-
163
-
164
-
165
-
166
-
167
-
168
-
169
-
170
-
171
-
172
-
173
-
174
-
175
-
176
-
177
-
178
-
179
-
180
-
181
-
182
-
183
-
184
-
185
-
186
-
187
-
188
-
189
-
190
-
191
-
192
-
193
-
194
-
195
-
196
-
197
-
198
-
199
-
200
-
201
-
202
-
203
-
204
-
205
-
206
-
207
-
208
-
209
-
210
-
211
-
212
-
213
-
214
-
215
-
216
-
217
-
218
-
219
-
220
-
221
-
222
-
223
-
224
-
225
-
226
-
227
-
228
-
229
-
230
-
231
-
232
-
233
-
234
-
235
-
236
 |
 |
80
Market Risk from Trading Activities
Under established policies and procedures, we manage market risk associated with trading activities using a VAR approach
that takes into account exposures resulting from interest rate risk, equity risk, foreign exchange risk, credit spread risk, and
commodity risk. For trading portfolios, VAR measures the estimated maximum loss from a trading position, given a specified
confidence level and time horizon. VAR results are monitored daily for each trading portfolio against established limits. For
risk management purposes, our VAR calculation measures the potential trading losses using a one-day holding period at a
one-tail, 99% confidence level. This means that, on average, trading losses are expected to exceed VAR one out of 100 trading
days or two to three times per year. While VAR can be a useful risk management tool, it does have inherent limitations including
the assumption that past market behavior is indicative of future market performance. As such, VAR is only one of several
tools used to manage trading risk. Other tools used to actively manage trading risk include scenario analysis, stress testing,
profit and loss attribution, and stop loss limits.
In addition to VAR, in accordance with the new Market Risk Rule, which was effective January 1, 2013, we also calculate
Stressed VAR, which is used as a component of the total market risk-based capital charge. We calculate the Stressed VAR
risk measure using a ten-day holding period at a one-tail, 99% confidence level and employ a historical simulation approach
based on a continuous twelve-month historical window that reflects a period of significant financial stress to our portfolio.
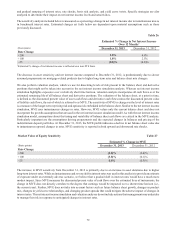
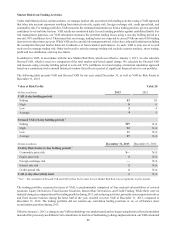
The following table presents VAR and Stressed VAR for the year ended December 31, as well as VAR by Risk Factor at
December 31, 2013:
Value at Risk Profile Table 28
(Dollars in millions) 2013 2012
VAR (1-day holding period)
Ending $3 $5
High 86
Low 24
Average 45
Stressed VAR (10-day holding period) 1
Ending $29 N/A
High 92 N/A
Low 11 N/A
Average 27 N/A
(Dollars in millions) December 31, 2013 December 31, 2012
VAR by Risk Factor (1-day holding period) 1
Commodity price risk $— N/A
Equity price risk 2N/A
Foreign exchange risk —N/A
Interest rate risk 2N/A
Credit spread risk 2N/A
VAR (1-day diversified) total 3 N/A
1 "N/A" - The calculation of Stressed VAR and VAR by Risk Factor under the new Market Risk Rule was not applicable in prior periods.
The trading portfolio, measured in terms of VAR, is predominantly comprised of four material sub-portfolios of covered
positions: Equity Derivatives, Fixed Income Securities, Interest Rate Derivatives, and Credit Trading. While there were no
material changes in composition of the trading portfolio during 2013, risk reducing activities, primarily in our equity derivatives
and fixed income business during the latter half of the year, resulted in lower VAR at December 31, 2013, compared to
December 31, 2012. The trading portfolio did not contain any correlation trading positions or on- or off-balance sheet
securitization positions during 2013.
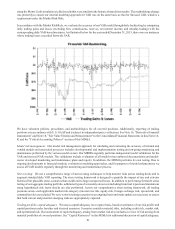
Effective January 1, 2013, a change to our VAR methodology was implemented and we began using historical based simulation
instead of the previously used Monte Carlo simulation. At the time of methodology change implementation, our VAR calculated