SunTrust 2013 Annual Report Download - page 105
Download and view the complete annual report
Please find page 105 of the 2013 SunTrust annual report below. You can navigate through the pages in the report by either clicking on the pages listed below, or by using the keyword search tool below to find specific information within the annual report.-
 1
1 -
2
-
3
-
4
-
5
-
6
-
7
-
8
-
9
-
10
-
11
-
12
-
13
-
14
-
15
-
16
-
17
-
18
-
19
-
20
-
21
-
22
-
23
-
24
-
25
-
26
-
27
-
28
-
29
-
30
-
31
-
32
-
33
-
34
-
35
-
36
-
37
-
38
-
39
-
40
-
41
-
42
-
43
-
44
-
45
-
46
-
47
-
48
-
49
-
50
-
51
-
52
-
53
-
54
-
55
-
56
-
57
-
58
-
59
-
60
-
61
-
62
-
63
-
64
-
65
-
66
-
67
-
68
-
69
-
70
-
71
-
72
-
73
-
74
-
75
-
76
-
77
-
78
-
79
-
80
-
81
-
82
-
83
-
84
-
85
-
86
-
87
-
88
-
89
-
90
-
91
-
92
-
93
-
94
-
 95
95 -
 96
96 -
 97
97 -
 98
98 -
 99
99 -
 100
100 -
 101
101 -
 102
102 -
 103
103 -
 104
104 -
 105
105 -
 106
106 -
 107
107 -
 108
108 -
 109
109 -
 110
110 -
 111
111 -
 112
112 -
 113
113 -
 114
114 -
 115
115 -
116
-
117
-
118
-
119
-
120
-
121
-
122
-
123
-
124
-
125
-
126
-
127
-
128
-
129
-
130
-
131
-
132
-
133
-
134
-
135
-
136
-
137
-
138
-
139
-
140
-
141
-
142
-
143
-
144
-
145
-
146
-
147
-
148
-
149
-
150
-
151
-
152
-
153
-
154
-
155
-
156
-
157
-
158
-
159
-
160
-
161
-
162
-
163
-
164
-
165
-
166
-
167
-
168
-
169
-
170
-
171
-
172
-
173
-
174
-
175
-
176
-
177
-
178
-
179
-
180
-
181
-
182
-
183
-
184
-
185
-
186
-
187
-
188
-
189
-
190
-
191
-
192
-
193
-
194
-
195
-
196
-
197
-
198
-
199
-
200
-
201
-
202
-
203
-
204
-
205
-
206
-
207
-
208
-
209
-
210
-
211
-
212
-
213
-
214
-
215
-
216
-
217
-
218
-
219
-
220
-
221
-
222
-
223
-
224
-
225
-
226
-
227
-
228
-
229
-
230
-
231
-
232
-
233
-
234
-
235
-
236
 |
 |

89
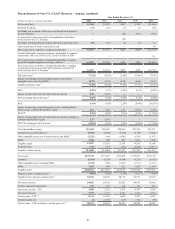
The income tax provision during the fourth quarter of 2013 was $122 million compared with an income tax provision of $62
million during the fourth quarter of 2012. The increase in the income tax provision was primarily the result of higher pre-tax
income in the fourth quarter of 2013 compared to the same period in 2012. The fourth quarter 2013 and 2012 effective tax
rates were favorably impacted by audit settlements, statute expirations, and/or changes in tax rates.
BUSINESS SEGMENTS
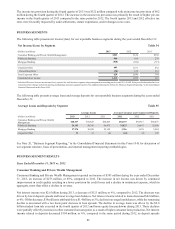
The following table presents net income/(loss) for our reportable business segments during the years ended December 31:
Net Income/(Loss) by Segment Table 34
(Dollars in millions) 2013 2012 2011
Consumer Banking and Private Wealth Management $583 $310 $350
Wholesale Banking 900 698 270
Mortgage Banking (568) (696) (717)
Corporate Other 485 1,517 432
Reconciling Items 1(56) 129 312
Total Corporate Other 429 1,646 744
Consolidated net income 1,344 1,958 647
1 Includes differences between net income/(loss) reported for each business segment using management accounting practices and U.S. GAAP. Prior period information has been
restated to reflect changes in internal reporting methodology and inter-segment transfers. See additional information in Note 20, "Business Segment Reporting," to the Consolidated
Financial Statements in this Form 10-K.
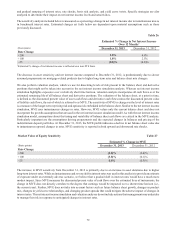
The following table presents average loans and average deposits for our reportable business segments during the years ended
December 31:
Average Loans and Deposits by Segment Table 35
Average Loans Average Consumer and Commercial Deposits
(Dollars in millions) 2013 2012 2011 2013 2012 2011
Consumer Banking and Private Wealth
Management $40,457 $41,823 $40,209 $84,107 $83,917 $84,477
Wholesale Banking 54,195 50,741 46,975 39,827 38,697 35,060
Mortgage Banking 27,974 30,288 29,128 3,206 3,638 3,084
Corporate Other 31 41 (4) (64) (3) 105
See Note 20, “Business Segment Reporting,” to the Consolidated Financial Statements in this Form 10-K for discussion of
our segment structure, basis of presentation, and internal management reporting methodologies.
BUSINESS SEGMENT RESULTS
Years Ended December 31, 2013 vs. 2012
Consumer Banking and Private Wealth Management
Consumer Banking and Private Wealth Management reported net income of $583 million during the year ended December
31, 2013, an increase of $273 million, or 88%, compared to 2012. The increase in net income was driven by continued
improvement in credit quality resulting in a lower provision for credit losses and a decline in noninterest expense, which in
aggregate, more than offset a decline in revenue.
Net interest income was $2.6 billion during 2013, a decrease of $121 million, or 4%, compared to 2012. The decrease was
driven by lower deposit spreads and lower average loan balances. Net interest income related to loans decreased $42 million,
or 4%. Of this decrease, $34 million is attributable to a $1.4 billion, or 3%, decline in average loan balances, while the remaining
decline is associated with a two basis point decrease in loan spreads. The decline in average loans was driven by the $2.0
billion student loan sale executed in the fourth quarter of 2012 and home equity line paydowns during 2013. These declines
were partially offset by increases in other consumer loan categories as a result of higher consumer loan production. Net interest
income related to deposits decreased $104 million, or 6%, compared to the same period during 2012, as deposit spreads