SunTrust 2013 Annual Report Download - page 192
Download and view the complete annual report
Please find page 192 of the 2013 SunTrust annual report below. You can navigate through the pages in the report by either clicking on the pages listed below, or by using the keyword search tool below to find specific information within the annual report.-
 1
1 -
2
-
3
-
4
-
5
-
6
-
7
-
8
-
9
-
10
-
11
-
12
-
13
-
14
-
15
-
16
-
17
-
18
-
19
-
20
-
21
-
22
-
23
-
24
-
25
-
26
-
27
-
28
-
29
-
30
-
31
-
32
-
33
-
34
-
35
-
36
-
37
-
38
-
39
-
40
-
41
-
42
-
43
-
44
-
45
-
46
-
47
-
48
-
49
-
50
-
51
-
52
-
53
-
54
-
55
-
56
-
57
-
58
-
59
-
60
-
61
-
62
-
63
-
64
-
65
-
66
-
67
-
68
-
69
-
70
-
71
-
72
-
73
-
74
-
75
-
76
-
77
-
78
-
79
-
80
-
81
-
82
-
83
-
84
-
85
-
86
-
87
-
88
-
89
-
90
-
91
-
92
-
93
-
94
-
95
-
96
-
97
-
98
-
99
-
100
-
101
-
102
-
103
-
104
-
105
-
106
-
107
-
108
-
109
-
110
-
111
-
112
-
113
-
114
-
115
-
116
-
117
-
118
-
119
-
120
-
121
-
122
-
123
-
124
-
125
-
126
-
127
-
128
-
129
-
130
-
131
-
132
-
133
-
134
-
135
-
136
-
137
-
138
-
139
-
140
-
141
-
142
-
143
-
144
-
145
-
146
-
147
-
148
-
149
-
150
-
151
-
152
-
153
-
154
-
155
-
156
-
157
-
158
-
159
-
160
-
161
-
162
-
163
-
164
-
165
-
166
-
167
-
168
-
169
-
170
-
171
-
172
-
173
-
174
-
175
-
176
-
177
-
178
-
179
-
180
-
181
-
 182
182 -
 183
183 -
 184
184 -
 185
185 -
 186
186 -
 187
187 -
 188
188 -
 189
189 -
 190
190 -
 191
191 -
 192
192 -
 193
193 -
 194
194 -
 195
195 -
 196
196 -
 197
197 -
 198
198 -
 199
199 -
 200
200 -
 201
201 -
 202
202 -
203
-
204
-
205
-
206
-
207
-
208
-
209
-
210
-
211
-
212
-
213
-
214
-
215
-
216
-
217
-
218
-
219
-
220
-
221
-
222
-
223
-
224
-
225
-
226
-
227
-
228
-
229
-
230
-
231
-
232
-
233
-
234
-
235
-
236
 |
 |

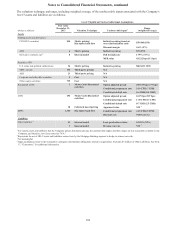
Notes to Consolidated Financial Statements, continued
176
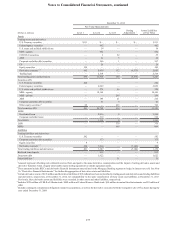
Recurring Fair Value Measurements
The following tables present certain information regarding assets and liabilities measured at fair value on a recurring basis
and the changes in fair value for those specific financial instruments in which fair value has been elected.
December 31, 2013
Fair Value Measurements
(Dollars in millions) Level 1 Level 2 Level 3
Netting
Adjustments 1Assets/Liabilities
at Fair Value
Assets
Trading assets and derivatives:
U.S. Treasury securities $219 $— $— $— $219
Federal agency securities — 426 — — 426
U.S. states and political subdivisions —65— — 65
MBS - agency — 323 — — 323
CDO/CLO securities — 3 54 — 57
ABS —— 6 — 6
Corporate and other debt securities — 534 — — 534
CP —29— — 29
Equity securities 109 — — — 109
Derivative contracts 2828 5,285 12 (4,741) 1,384
Trading loans — 1,888 — — 1,888
Total trading assets and derivatives 1,156 8,553 72 (4,741) 5,040
Securities AFS:
U.S. Treasury securities 1,293 — — — 1,293
Federal agency securities — 984 — — 984
U.S. states and political subdivisions — 203 34 — 237
MBS - agency — 18,911 — — 18,911
MBS - private — — 154 — 154
ABS —5821 — 79
Corporate and other debt securities —37 5 — 42
Other equity securities 3103 — 739 — 842
Total securities AFS 1,396 20,193 953 — 22,542
LHFS:
Residential loans — 1,114 3 — 1,117
Corporate and other loans — 261 — — 261
Total LHFS — 1,375 3 — 1,378
LHFI — — 302 — 302
MSRs — — 1,300 — 1,300
Liabilities
Trading liabilities and derivatives:
U.S. Treasury securities 472 — — — 472
Corporate and other debt securities — 179 — — 179
Equity securities 5—— — 5
Derivative contracts 2502 5,167 4 (5,148) 525
Total trading liabilities and derivatives 979 5,346 4 (5,148) 1,181
Brokered time deposits — 764 — — 764
Long-term debt — 1,556 — — 1,556
Other liabilities 4——29 — 29
1 Amounts represent offsetting cash collateral received from and paid to the same derivative counterparties and the impact of netting derivative assets and
derivative liabilities when a legally enforceable master netting agreement or similar agreement exists.
2 These amounts include IRLCs and derivative financial instruments entered into by the Mortgage Banking segment to hedge its interest rate risk. See Note
16, "Derivative Financial Instruments," for further disaggregation of derivative assets and liabilities.
3 Includes $336 million of FHLB of Atlanta stock, $402 million of Federal Reserve Bank stock, $103 million in mutual fund investments, and $1 million of
other.
4 Includes contingent consideration obligations related to acquisitions, as well as the derivative associated with the Company's sale of Visa shares during the
year ended December 31, 2009.