SunTrust 2013 Annual Report Download - page 51
Download and view the complete annual report
Please find page 51 of the 2013 SunTrust annual report below. You can navigate through the pages in the report by either clicking on the pages listed below, or by using the keyword search tool below to find specific information within the annual report.-
 1
1 -
2
-
3
-
4
-
5
-
6
-
7
-
8
-
9
-
10
-
11
-
12
-
13
-
14
-
15
-
16
-
17
-
18
-
19
-
20
-
21
-
22
-
23
-
24
-
25
-
26
-
27
-
28
-
29
-
30
-
31
-
32
-
33
-
34
-
35
-
36
-
37
-
38
-
39
-
40
-
 41
41 -
 42
42 -
 43
43 -
 44
44 -
 45
45 -
 46
46 -
 47
47 -
 48
48 -
 49
49 -
 50
50 -
 51
51 -
 52
52 -
 53
53 -
 54
54 -
 55
55 -
 56
56 -
 57
57 -
 58
58 -
 59
59 -
 60
60 -
 61
61 -
62
-
63
-
64
-
65
-
66
-
67
-
68
-
69
-
70
-
71
-
72
-
73
-
74
-
75
-
76
-
77
-
78
-
79
-
80
-
81
-
82
-
83
-
84
-
85
-
86
-
87
-
88
-
89
-
90
-
91
-
92
-
93
-
94
-
95
-
96
-
97
-
98
-
99
-
100
-
101
-
102
-
103
-
104
-
105
-
106
-
107
-
108
-
109
-
110
-
111
-
112
-
113
-
114
-
115
-
116
-
117
-
118
-
119
-
120
-
121
-
122
-
123
-
124
-
125
-
126
-
127
-
128
-
129
-
130
-
131
-
132
-
133
-
134
-
135
-
136
-
137
-
138
-
139
-
140
-
141
-
142
-
143
-
144
-
145
-
146
-
147
-
148
-
149
-
150
-
151
-
152
-
153
-
154
-
155
-
156
-
157
-
158
-
159
-
160
-
161
-
162
-
163
-
164
-
165
-
166
-
167
-
168
-
169
-
170
-
171
-
172
-
173
-
174
-
175
-
176
-
177
-
178
-
179
-
180
-
181
-
182
-
183
-
184
-
185
-
186
-
187
-
188
-
189
-
190
-
191
-
192
-
193
-
194
-
195
-
196
-
197
-
198
-
199
-
200
-
201
-
202
-
203
-
204
-
205
-
206
-
207
-
208
-
209
-
210
-
211
-
212
-
213
-
214
-
215
-
216
-
217
-
218
-
219
-
220
-
221
-
222
-
223
-
224
-
225
-
226
-
227
-
228
-
229
-
230
-
231
-
232
-
233
-
234
-
235
-
236
 |
 |

35
in basis, will be approximately 9.6%, which would be in compliance with the capital requirements. See the "Reconcilement of
Non-U.S. GAAP Measures - Annual" section in this MD&A for a reconciliation of the current Basel I ratio to the estimated Basel
III ratio. See additional discussion of Basel III in the "Capital Resources" section of this MD&A.
Financial performance
Net income available to common shareholders during 2013 was $1.3 billion, or $2.41 per average diluted common share, compared
to $1.9 billion, or $3.59 per average diluted common share, in 2012, and $495 million, or $0.94 per average diluted common share,
in 2011. Net income in 2013 included a $179 million negative impact, or $0.33 per average diluted common share, of items related
primarily to the recognition of certain legacy mortgage-related and other matters and the completion of a taxable reorganization
of certain subsidiaries. In comparison, during 2012 our net income included $753 million of additional income, or $1.40 per average
diluted common share, driven by the early termination of agreements regarding the shares previously owned in Coke resulting in
the sale and charitable contribution of those shares, net of certain expenses related to strategic actions taken during 2012 to
strengthen our balance sheet. A summary of the significant items impacting each year is as follows:
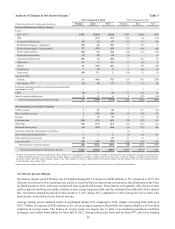
Table 1
Year Ended December 31
($ in millions, except per share amounts) 2013 2012 2011
Net income available to common shareholders $1,297 $1,931 $495
Significant items impacting the year:
Operating losses related to recognition of certain mortgage-related legal matters 323 ——
Mortgage repurchase provision related to repurchase settlements 63 ——
Provision for unrecoverable servicing advances 96 ——
Securities gains related to sale of Coke stock —(1,938) —
Mortgage repurchase provision —371 —
Charitable expense related to the Coke stock contribution —38 —
Provision for credit losses related to NPL sales —172 —
Losses on sale of guaranteed loans —92 —
Valuation losses related to planned sale of Affordable Housing investments —96 —
Tax (benefit)/expense related to above items (190)416 —
Net tax benefit related to subsidiary reorganization and other (113)——
Net income available to common shareholders, excluding significant items impacting
the year $1,476 $1,178 $495
Net income per average common share, diluted $2.41 $3.59 $0.94
Net income per average common share, diluted, excluding significant items impacting
the year $2.74 $2.19 $0.94
The 2013 items noted above primarily related to the recognition of certain legacy mortgage-related and other matters and also
included the impact of the completion of a taxable reorganization of certain subsidiaries along with other less significant tax
matters. Addressing these matters improves our overall risk profile. Further details about these strategic actions can be found in
our Form 8-K that was filed with the SEC on October 10, 2013. The 2012 items noted above related to strategic actions taken
during 2012 to improve our risk profile and strengthen our capital and balance sheet. Further details about these strategic actions
can be found in our 2012 Form 10-K and in our Form 8-K that was filed with the SEC on September 6, 2012. When excluding
these items, our net income and diluted earnings per common share increased 25% during 2013 compared to 2012, primarily as a
result of the continued improvement in credit quality that led to lower provision for credit losses and lower noninterest expense.
Our net income and diluted earnings per common share increased over 100% during 2012 compared to 2011 when excluding the
Form 8-K items. The increase was primarily driven by improved mortgage-related income, lower provision for credit losses, and
less preferred dividends and accelerated accretion related to the U.S. government's TARP investment, which was repaid in 2011.
See Table 36, "Reconcilement of Non-U.S. GAAP Measures - Annual," for a reconciliation of net income available to common
shareholders and net income per average common share, diluted, excluding the Form 8-K items.
Our provision for credit losses declined 60% during 2013 compared to 2012. The decrease was as a result of continued credit
quality improvement and the 2012 impacts related to Chapter 7 bankruptcy loan reclassifications to nonperforming and a junior
lien policy change related to nonaccrual status and timing of charge-off recognition. Noninterest expense decreased 7% in 2013;
however, when excluding the Form 8-K items, decreased 12% compared to 2012 as a result of our ongoing efficiency improvement
efforts as well as the abatement of cyclically high credit-related costs. Partially offsetting the improvement in provision for credit