SunTrust 2013 Annual Report Download - page 116
Download and view the complete annual report
Please find page 116 of the 2013 SunTrust annual report below. You can navigate through the pages in the report by either clicking on the pages listed below, or by using the keyword search tool below to find specific information within the annual report.-
 1
1 -
2
-
3
-
4
-
5
-
6
-
7
-
8
-
9
-
10
-
11
-
12
-
13
-
14
-
15
-
16
-
17
-
18
-
19
-
20
-
21
-
22
-
23
-
24
-
25
-
26
-
27
-
28
-
29
-
30
-
31
-
32
-
33
-
34
-
35
-
36
-
37
-
38
-
39
-
40
-
41
-
42
-
43
-
44
-
45
-
46
-
47
-
48
-
49
-
50
-
51
-
52
-
53
-
54
-
55
-
56
-
57
-
58
-
59
-
60
-
61
-
62
-
63
-
64
-
65
-
66
-
67
-
68
-
69
-
70
-
71
-
72
-
73
-
74
-
75
-
76
-
77
-
78
-
79
-
80
-
81
-
82
-
83
-
84
-
85
-
86
-
87
-
88
-
89
-
90
-
91
-
92
-
93
-
94
-
95
-
96
-
97
-
98
-
99
-
100
-
101
-
102
-
103
-
104
-
105
-
 106
106 -
 107
107 -
 108
108 -
 109
109 -
 110
110 -
 111
111 -
 112
112 -
 113
113 -
 114
114 -
 115
115 -
 116
116 -
 117
117 -
 118
118 -
 119
119 -
 120
120 -
 121
121 -
 122
122 -
 123
123 -
 124
124 -
 125
125 -
 126
126 -
127
-
128
-
129
-
130
-
131
-
132
-
133
-
134
-
135
-
136
-
137
-
138
-
139
-
140
-
141
-
142
-
143
-
144
-
145
-
146
-
147
-
148
-
149
-
150
-
151
-
152
-
153
-
154
-
155
-
156
-
157
-
158
-
159
-
160
-
161
-
162
-
163
-
164
-
165
-
166
-
167
-
168
-
169
-
170
-
171
-
172
-
173
-
174
-
175
-
176
-
177
-
178
-
179
-
180
-
181
-
182
-
183
-
184
-
185
-
186
-
187
-
188
-
189
-
190
-
191
-
192
-
193
-
194
-
195
-
196
-
197
-
198
-
199
-
200
-
201
-
202
-
203
-
204
-
205
-
206
-
207
-
208
-
209
-
210
-
211
-
212
-
213
-
214
-
215
-
216
-
217
-
218
-
219
-
220
-
221
-
222
-
223
-
224
-
225
-
226
-
227
-
228
-
229
-
230
-
231
-
232
-
233
-
234
-
235
-
236
 |
 |
100
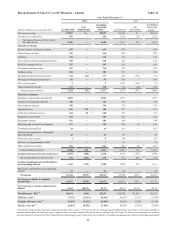
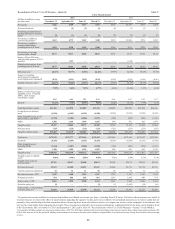
3We present a tangible efficiency ratio which excludes the impairment/amortization of goodwill/intangible assets. We believe this measure is useful to investors because, by removing
the effect of these intangible asset costs (the level of which may vary from company to company), it allows investors to more easily compare our efficiency to other companies in
the industry. This measure is utilized by us to assess our efficiency and that of our lines of business.
4We present ROTCE to exclude intangible assets, except for MSRs, from average common shareholders' equity. We believe this measure is useful to investors because, by removing
the effect of intangible assets, except for MSRs, (the level of which may vary from company to company), it allows investors to more easily compare our ROE to other companies
in the industry who present a similar measure. We also believe that removing intangible assets, except for MSRs, is a more relevant measure of the return on our common shareholders'
equity.
5Net of deferred taxes of $186 million, $180 million, $174 million, and $169 million, respectively, in 2013; and $163 million, $159 million, $156 million, and $164 million,
respectively, in 2012.
6Net of deferred taxes of $2 million, $2 million, $4 million, and $5 million in 2013; and $7 million, $8 million, $10 million, and $14 million, respectively, in 2012.
7We present a tangible equity to tangible assets ratio that excludes the after-tax impact of purchase accounting intangible assets. We believe this measure is useful to investors
because, by removing the effect of intangible assets that result from merger and acquisition activity (the level of which may vary from company to company), it allows investors
to more easily compare our capital adequacy to other companies in the industry. This measure is used by us to analyze capital adequacy.
8We present a tangible book value per common share that excludes the after-tax impact of purchase accounting intangible assets and also excludes preferred stock from tangible
equity. We believe this measure is useful to investors because, by removing the effect of intangible assets that result from merger and acquisition activity as well as preferred stock
(the level of which may vary from company to company), it allows investors to more easily compare our common stock book value to other companies in the industry.
9We present total revenue - FTE excluding net securities gains. Total Revenue is calculated as net interest income - FTE plus noninterest income. Net interest income is presented
on an FTE basis, which adjusts for the tax-favored status of net interest income from certain loans and investments. We believe this measure to be the preferred industry measurement
of net interest income and it enhances comparability of net interest income arising from taxable and tax-exempt sources. We also believe that revenue without net securities gains
is more indicative of our performance because it isolates income that is primarily client relationship and client transaction driven and is more indicative of normalized operations.