SunTrust 2013 Annual Report Download - page 63
Download and view the complete annual report
Please find page 63 of the 2013 SunTrust annual report below. You can navigate through the pages in the report by either clicking on the pages listed below, or by using the keyword search tool below to find specific information within the annual report.-
 1
1 -
2
-
3
-
4
-
5
-
6
-
7
-
8
-
9
-
10
-
11
-
12
-
13
-
14
-
15
-
16
-
17
-
18
-
19
-
20
-
21
-
22
-
23
-
24
-
25
-
26
-
27
-
28
-
29
-
30
-
31
-
32
-
33
-
34
-
35
-
36
-
37
-
38
-
39
-
40
-
41
-
42
-
43
-
44
-
45
-
46
-
47
-
48
-
49
-
50
-
51
-
52
-
 53
53 -
 54
54 -
 55
55 -
 56
56 -
 57
57 -
 58
58 -
 59
59 -
 60
60 -
 61
61 -
 62
62 -
 63
63 -
 64
64 -
 65
65 -
 66
66 -
 67
67 -
 68
68 -
 69
69 -
 70
70 -
 71
71 -
 72
72 -
 73
73 -
74
-
75
-
76
-
77
-
78
-
79
-
80
-
81
-
82
-
83
-
84
-
85
-
86
-
87
-
88
-
89
-
90
-
91
-
92
-
93
-
94
-
95
-
96
-
97
-
98
-
99
-
100
-
101
-
102
-
103
-
104
-
105
-
106
-
107
-
108
-
109
-
110
-
111
-
112
-
113
-
114
-
115
-
116
-
117
-
118
-
119
-
120
-
121
-
122
-
123
-
124
-
125
-
126
-
127
-
128
-
129
-
130
-
131
-
132
-
133
-
134
-
135
-
136
-
137
-
138
-
139
-
140
-
141
-
142
-
143
-
144
-
145
-
146
-
147
-
148
-
149
-
150
-
151
-
152
-
153
-
154
-
155
-
156
-
157
-
158
-
159
-
160
-
161
-
162
-
163
-
164
-
165
-
166
-
167
-
168
-
169
-
170
-
171
-
172
-
173
-
174
-
175
-
176
-
177
-
178
-
179
-
180
-
181
-
182
-
183
-
184
-
185
-
186
-
187
-
188
-
189
-
190
-
191
-
192
-
193
-
194
-
195
-
196
-
197
-
198
-
199
-
200
-
201
-
202
-
203
-
204
-
205
-
206
-
207
-
208
-
209
-
210
-
211
-
212
-
213
-
214
-
215
-
216
-
217
-
218
-
219
-
220
-
221
-
222
-
223
-
224
-
225
-
226
-
227
-
228
-
229
-
230
-
231
-
232
-
233
-
234
-
235
-
236
 |
 |

47
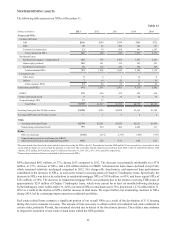
Consumer
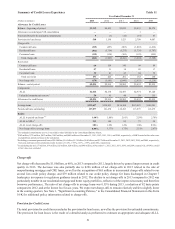
The loan types comprising our consumer loan segment include government-guaranteed student loans, other direct (consisting
primarily of direct auto loans, loans secured by negotiable collateral, and private student loans), indirect (consisting of loans
secured by automobiles, boats, or recreational vehicles), and consumer credit cards.
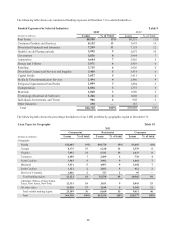
The composition of our loan portfolio at December 31 is shown in the following table:
Loan Portfolio by Types of Loans Table 7
(Dollars in millions) 2013 2012 2011 2010 2009
Commercial loans:
C&I $57,974 $54,048 $49,538 $44,753 $44,008
CRE 5,481 4,127 5,094 6,167 6,694
Commercial construction 855 713 1,240 2,568 4,984
Total commercial loans 64,310 58,888 55,872 53,488 55,686
Residential loans:
Residential mortgages - guaranteed 3,416 4,252 6,672 4,520 949
Residential mortgages - nonguaranteed124,412 23,389 23,243 23,959 25,847
Home equity products 14,809 14,805 15,765 16,751 17,783
Residential construction 553 753 980 1,291 1,909
Total residential loans 43,190 43,199 46,660 46,521 46,488
Consumer loans:
Guaranteed student loans 5,545 5,357 7,199 4,260 2,786
Other direct 2,829 2,396 2,059 1,722 1,484
Indirect 11,272 10,998 10,165 9,499 6,665
Credit cards 731 632 540 485 566
Total consumer loans 20,377 19,383 19,963 15,966 11,501
LHFI $127,877 $121,470 $122,495 $115,975 $113,675
LHFS $1,699 $3,399 $2,353 $3,501 $4,670
1 Includes $302 million, $379 million, $431 million, $488 million, and $437 million of loans carried at fair value at December 31, 2013, 2012, 2011,
2010, and 2009, respectively.
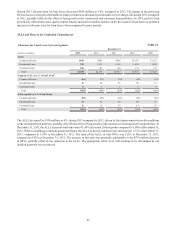
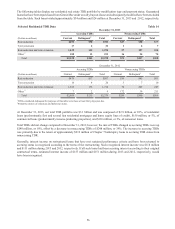
We believe that our loan portfolio is well diversified by product, client, and geography throughout our footprint. However,
our loan portfolio may be exposed to certain concentrations of credit risk which exist in relation to individual borrowers or
groups of borrowers, certain types of collateral, certain industries, certain loan products, or certain regions of the country. As
seen below in Table 10, we have experienced a shift in our loans by geography since December 31, 2012. Specifically, the
percentage of our loans to clients outside of our banking footprint compared to our total loan portfolio increased, primarily
as a result of an increase in loans in our CIB business which serves clients nationwide. See Note 6, “Loans,” to the Consolidated
Financial Statements in this Form 10-K for more information.
Selected Loan Maturity Data Table 8
(Dollars in millions)
At December 31, 2013
Total 1 year or less 1-5 years After 5 years
Loan Maturity
Commercial and commercial real estate 1$57,880 $21,953 $32,414 $3,513
Real estate - construction 855 155 634 66
Total $58,735 $22,108 $33,048 $3,579
Interest Rate Sensitivity
Selected loans with:
Predetermined interest rates $5,124 $1,989
Floating or adjustable interest rates 27,924 1,590
Total $33,048 $3,579
1 Excludes $4.9 billion in lease financing and $705 million in installment loans.