SunTrust 2013 Annual Report Download - page 144
Download and view the complete annual report
Please find page 144 of the 2013 SunTrust annual report below. You can navigate through the pages in the report by either clicking on the pages listed below, or by using the keyword search tool below to find specific information within the annual report.-
 1
1 -
2
-
3
-
4
-
5
-
6
-
7
-
8
-
9
-
10
-
11
-
12
-
13
-
14
-
15
-
16
-
17
-
18
-
19
-
20
-
21
-
22
-
23
-
24
-
25
-
26
-
27
-
28
-
29
-
30
-
31
-
32
-
33
-
34
-
35
-
36
-
37
-
38
-
39
-
40
-
41
-
42
-
43
-
44
-
45
-
46
-
47
-
48
-
49
-
50
-
51
-
52
-
53
-
54
-
55
-
56
-
57
-
58
-
59
-
60
-
61
-
62
-
63
-
64
-
65
-
66
-
67
-
68
-
69
-
70
-
71
-
72
-
73
-
74
-
75
-
76
-
77
-
78
-
79
-
80
-
81
-
82
-
83
-
84
-
85
-
86
-
87
-
88
-
89
-
90
-
91
-
92
-
93
-
94
-
95
-
96
-
97
-
98
-
99
-
100
-
101
-
102
-
103
-
104
-
105
-
106
-
107
-
108
-
109
-
110
-
111
-
112
-
113
-
114
-
115
-
116
-
117
-
118
-
119
-
120
-
121
-
122
-
123
-
124
-
125
-
126
-
127
-
128
-
129
-
130
-
131
-
132
-
133
-
 134
134 -
 135
135 -
 136
136 -
 137
137 -
 138
138 -
 139
139 -
 140
140 -
 141
141 -
 142
142 -
 143
143 -
 144
144 -
 145
145 -
 146
146 -
 147
147 -
 148
148 -
 149
149 -
 150
150 -
 151
151 -
 152
152 -
 153
153 -
 154
154 -
155
-
156
-
157
-
158
-
159
-
160
-
161
-
162
-
163
-
164
-
165
-
166
-
167
-
168
-
169
-
170
-
171
-
172
-
173
-
174
-
175
-
176
-
177
-
178
-
179
-
180
-
181
-
182
-
183
-
184
-
185
-
186
-
187
-
188
-
189
-
190
-
191
-
192
-
193
-
194
-
195
-
196
-
197
-
198
-
199
-
200
-
201
-
202
-
203
-
204
-
205
-
206
-
207
-
208
-
209
-
210
-
211
-
212
-
213
-
214
-
215
-
216
-
217
-
218
-
219
-
220
-
221
-
222
-
223
-
224
-
225
-
226
-
227
-
228
-
229
-
230
-
231
-
232
-
233
-
234
-
235
-
236
 |
 |

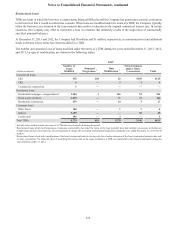
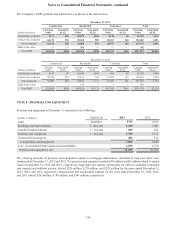
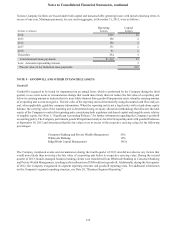
Notes to Consolidated Financial Statements, continued
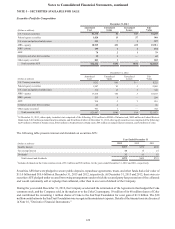
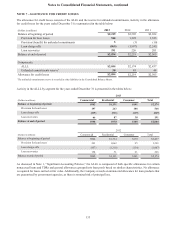
128
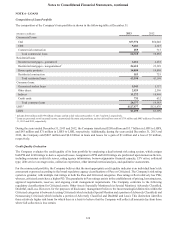
Year Ended December 31
2013 2012 2011
(Dollars in millions)
Average
Amortized
Cost
Interest
Income
Recognized1
Average
Amortized
Cost
Interest
Income
Recognized1
Average
Amortized
Cost
Interest
Income
Recognized1
Impaired loans with no related allowance recorded:
Commercial loans:
C&I $75 $1 $48 $1 $109 $3
CRE 60 2 9 — 56 1
Commercial construction ——
45 1 47 1
Total commercial loans 135 3 102 2 212 5
Impaired loans with an allowance recorded:
Commercial loans:
C&I 45 1 51 1 68 1
CRE 3—
9 — 103 2
Commercial construction 5—
4 — 121 2
Total commercial loans 53 1 64 1 292 5
Residential loans:
Residential mortgages - nonguaranteed 2,025 94 2,063 83 2,451 88
Home equity products 649 23 627 26 528 23
Residential construction 193 11 209 10 229 8
Total residential loans 2,867 128 2,899 119 3,208 119
Consumer loans:
Other direct 15 1 15 1 13 1
Indirect 89 4 50 2 — —
Credit cards 16 1 24 2 26 2
Total consumer loans 120 6 89 5 39 3
Total impaired loans $3,175 $138 $3,154 $127 $3,751 $132
1 Of the interest income recognized during the year ended December 31, 2013, 2012, and 2011, cash basis interest income was $10 million, $18 million, and $25
million, respectively.
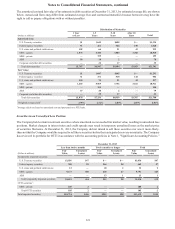
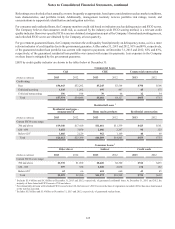
NPAs are shown in the following table at December 31:
(Dollars in millions) 2013 2012
Nonaccrual/NPLs:
Commercial loans:
C&I $196 $194
CRE 39 66
Commercial construction 12 34
Residential loans:
Residential mortgages - nonguaranteed 441 775
Home equity products 210 341
Residential construction 61 112
Consumer loans:
Other direct 56
Indirect 719
Total nonaccrual/NPLs2971 1,547
OREO1170 264
Other repossessed assets 79
Nonperforming LHFS 17 37
Total NPAs $1,165 $1,857
1 Does not include foreclosed real estate related to loans insured by the FHA or the VA. Proceeds due from the FHA and the VA are recorded as a receivable in
other assets in the Consolidated Balance Sheets until the funds are received and the property is conveyed. The receivable amount related to proceeds due from
the FHA or the VA totaled $88 million and $140 million at December 31, 2013 and 2012, respectively.
2 Nonaccruing restructured loans are included in total nonaccrual/NPLs.