SunTrust 2013 Annual Report Download - page 200
Download and view the complete annual report
Please find page 200 of the 2013 SunTrust annual report below. You can navigate through the pages in the report by either clicking on the pages listed below, or by using the keyword search tool below to find specific information within the annual report.-
 1
1 -
2
-
3
-
4
-
5
-
6
-
7
-
8
-
9
-
10
-
11
-
12
-
13
-
14
-
15
-
16
-
17
-
18
-
19
-
20
-
21
-
22
-
23
-
24
-
25
-
26
-
27
-
28
-
29
-
30
-
31
-
32
-
33
-
34
-
35
-
36
-
37
-
38
-
39
-
40
-
41
-
42
-
43
-
44
-
45
-
46
-
47
-
48
-
49
-
50
-
51
-
52
-
53
-
54
-
55
-
56
-
57
-
58
-
59
-
60
-
61
-
62
-
63
-
64
-
65
-
66
-
67
-
68
-
69
-
70
-
71
-
72
-
73
-
74
-
75
-
76
-
77
-
78
-
79
-
80
-
81
-
82
-
83
-
84
-
85
-
86
-
87
-
88
-
89
-
90
-
91
-
92
-
93
-
94
-
95
-
96
-
97
-
98
-
99
-
100
-
101
-
102
-
103
-
104
-
105
-
106
-
107
-
108
-
109
-
110
-
111
-
112
-
113
-
114
-
115
-
116
-
117
-
118
-
119
-
120
-
121
-
122
-
123
-
124
-
125
-
126
-
127
-
128
-
129
-
130
-
131
-
132
-
133
-
134
-
135
-
136
-
137
-
138
-
139
-
140
-
141
-
142
-
143
-
144
-
145
-
146
-
147
-
148
-
149
-
150
-
151
-
152
-
153
-
154
-
155
-
156
-
157
-
158
-
159
-
160
-
161
-
162
-
163
-
164
-
165
-
166
-
167
-
168
-
169
-
170
-
171
-
172
-
173
-
174
-
175
-
176
-
177
-
178
-
179
-
180
-
181
-
182
-
183
-
184
-
185
-
186
-
187
-
188
-
189
-
 190
190 -
 191
191 -
 192
192 -
 193
193 -
 194
194 -
 195
195 -
 196
196 -
 197
197 -
 198
198 -
 199
199 -
 200
200 -
 201
201 -
 202
202 -
 203
203 -
 204
204 -
 205
205 -
 206
206 -
 207
207 -
 208
208 -
 209
209 -
 210
210 -
211
-
212
-
213
-
214
-
215
-
216
-
217
-
218
-
219
-
220
-
221
-
222
-
223
-
224
-
225
-
226
-
227
-
228
-
229
-
230
-
231
-
232
-
233
-
234
-
235
-
236
 |
 |
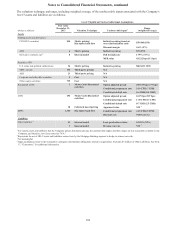
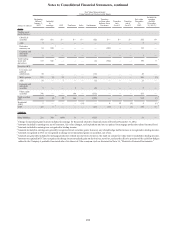
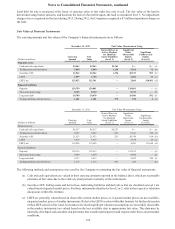
Notes to Consolidated Financial Statements, continued
184
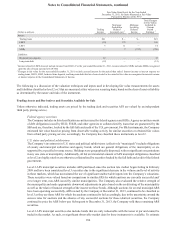
and 2011, the Company recognized gains of $1 million and $10 million, and losses of $4 million, respectively, due
to changes in fair value attributable to borrower-specific credit risk in the Consolidated Statements of Income. The
Company obtains fair value estimates for substantially all of these loans using a third party valuation service that is
broadly used by market participants. While most of the loans are traded in the markets, the Company does not believe
the loans qualify as level 1 instruments, as the volume and level of trading activity is subject to variability and the
loans are not exchange-traded, such that the Company believes that level 2 is more representative of the general
market activity for the loans.
LHFI
Level 3 LHFI predominantly includes mortgage loans that are deemed not marketable, largely due to the identification
of loan defects. The Company values these loans using a discounted cash flow approach based on assumptions that
are generally not observable in the current markets, such as prepayment speeds, default rates, loss severity rates, and
discount rates. These assumptions have an inverse relationship to the overall fair value. Level 3 LHFI also includes
mortgage loans that are valued using collateral based pricing. Changes in the applicable housing price index since
the time of the loan origination are considered and applied to the loan's collateral value. An additional discount
representing the return that a buyer would require is also considered in the overall fair value.
Other Intangible Assets
Other intangible assets that the Company records at fair value are the Company’s MSR assets. The fair values of MSRs are
determined by projecting cash flows, which are then discounted to estimate an expected fair value. The fair values of MSRs
are impacted by a variety of factors, including prepayment assumptions, discount rates, delinquency rates, contractually
specified servicing fees, servicing costs, and underlying portfolio characteristics. For additional information, see Note 9,
"Goodwill and Other Intangible Assets." The underlying assumptions and estimated values are corroborated by values received
from independent third parties based on their review of the servicing portfolio. Because these inputs are not transparent in
market trades, MSRs are considered to be level 3 assets.
Liabilities
Trading liabilities and derivatives
Trading liabilities are primarily comprised of derivative contracts, but also include various contracts involving U.S.
Treasury securities, equity securities, and corporate and other debt securities that the Company uses in certain of its
trading businesses. The Company employs the same valuation methodologies for these derivative contracts and
securities as are discussed within the corresponding sections herein under “Trading Assets and Derivatives and
Securities Available for Sale.”
Brokered time deposits
The Company has elected to measure certain CDs at fair value. These debt instruments include embedded derivatives
that are generally based on underlying equity securities or equity indices, but may be based on other underlyings that
may or may not be clearly and closely related to the host debt instrument. The Company elected to carry certain of
these instruments at fair value to better align the economics of the CDs with the Company’s risk management strategies.
The Company evaluated, on an instrument by instrument basis, whether a new issuance would be carried at fair value.
The Company classified these CDs as level 2 instruments due to the Company’s ability to reasonably measure all
significant inputs based on observable market variables. The Company employs a discounted cash flow approach to
the host debt component of the CD, based on observable market interest rates for the term of the CD and an estimate
of the Bank’s credit risk. For the embedded derivative features, the Company uses the same valuation methodologies
as if the derivative were a standalone derivative, as discussed herein under “Derivative contracts.”
For brokered time deposits carried at fair value, the Company estimated credit spreads above LIBOR, based on credit
spreads from actual or estimated trading levels of the debt or other relevant market data. For the years ended December
31, 2013, 2012, and 2011, the Company recognized $3 million and $15 million of losses and $2 million of gains,
respectively, due to changes in its own credit spread on its brokered time deposits carried at fair value.
Long-term debt
The Company has elected to carry at fair value certain fixed rate debt issuances of public debt which are valued by
obtaining quotes from a third party pricing service and utilizing broker quotes to corroborate the reasonableness of
those marks. Additionally, information from market data of recent observable trades and indications from buy side
investors, if available, are taken into consideration as additional support for the value. Due to the availability of this
information, the Company determined that the appropriate classification for the debt is level 2. The election to fair