SunTrust 2013 Annual Report Download - page 119
Download and view the complete annual report
Please find page 119 of the 2013 SunTrust annual report below. You can navigate through the pages in the report by either clicking on the pages listed below, or by using the keyword search tool below to find specific information within the annual report.-
 1
1 -
2
-
3
-
4
-
5
-
6
-
7
-
8
-
9
-
10
-
11
-
12
-
13
-
14
-
15
-
16
-
17
-
18
-
19
-
20
-
21
-
22
-
23
-
24
-
25
-
26
-
27
-
28
-
29
-
30
-
31
-
32
-
33
-
34
-
35
-
36
-
37
-
38
-
39
-
40
-
41
-
42
-
43
-
44
-
45
-
46
-
47
-
48
-
49
-
50
-
51
-
52
-
53
-
54
-
55
-
56
-
57
-
58
-
59
-
60
-
61
-
62
-
63
-
64
-
65
-
66
-
67
-
68
-
69
-
70
-
71
-
72
-
73
-
74
-
75
-
76
-
77
-
78
-
79
-
80
-
81
-
82
-
83
-
84
-
85
-
86
-
87
-
88
-
89
-
90
-
91
-
92
-
93
-
94
-
95
-
96
-
97
-
98
-
99
-
100
-
101
-
102
-
103
-
104
-
105
-
106
-
107
-
108
-
 109
109 -
 110
110 -
 111
111 -
 112
112 -
 113
113 -
 114
114 -
 115
115 -
 116
116 -
 117
117 -
 118
118 -
 119
119 -
 120
120 -
 121
121 -
 122
122 -
 123
123 -
 124
124 -
 125
125 -
 126
126 -
 127
127 -
 128
128 -
 129
129 -
130
-
131
-
132
-
133
-
134
-
135
-
136
-
137
-
138
-
139
-
140
-
141
-
142
-
143
-
144
-
145
-
146
-
147
-
148
-
149
-
150
-
151
-
152
-
153
-
154
-
155
-
156
-
157
-
158
-
159
-
160
-
161
-
162
-
163
-
164
-
165
-
166
-
167
-
168
-
169
-
170
-
171
-
172
-
173
-
174
-
175
-
176
-
177
-
178
-
179
-
180
-
181
-
182
-
183
-
184
-
185
-
186
-
187
-
188
-
189
-
190
-
191
-
192
-
193
-
194
-
195
-
196
-
197
-
198
-
199
-
200
-
201
-
202
-
203
-
204
-
205
-
206
-
207
-
208
-
209
-
210
-
211
-
212
-
213
-
214
-
215
-
216
-
217
-
218
-
219
-
220
-
221
-
222
-
223
-
224
-
225
-
226
-
227
-
228
-
229
-
230
-
231
-
232
-
233
-
234
-
235
-
236
 |
 |

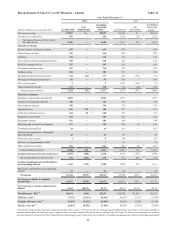
103
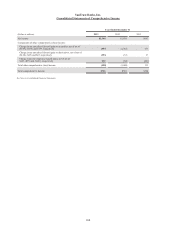
SunTrust Banks, Inc.
Consolidated Statements of Income
Year Ended December 31
(Dollars in millions and shares in thousands, except per share data) 2013 2012 2011
Interest Income
Interest and fees on loans $4,633 $5,035 $5,219
Interest and fees on loans held for sale 107 112 93
Interest and dividends on securities available for sale 1579 655 791
Trading account interest and other 69 65 78
Total interest income 5,388 5,867 6,181
Interest Expense
Interest on deposits 291 429 624
Interest on long-term debt 210 299 449
Interest on other borrowings 34 37 43
Total interest expense 535 765 1,116
Net interest income 4,853 5,102 5,065
Provision for credit losses 553 1,395 1,513
Net interest income after provision for credit losses 4,300 3,707 3,552
Noninterest Income
Service charges on deposit accounts 657 676 685
Other charges and fees 369 402 415
Card fees 310 316 463
Trust and investment management income 518 512 531
Retail investment services 267 241 230
Investment banking income 356 342 317
Trading income 182 211 248
Mortgage production related income/(loss) 314 343 (5)
Mortgage servicing related income 87 260 224
Net securities gains 221,974 117
Other noninterest income 152 96 196
Total noninterest income 3,214 5,373 3,421
Noninterest Expense
Employee compensation 2,488 2,603 2,494
Employee benefits 413 474 382
Outside processing and software 746 710 653
Net occupancy expense 348 359 356
Operating losses 503 277 377
Credit and collection services 264 239 275
Regulatory assessments 181 233 300
Equipment expense 181 188 178
Marketing and customer development 135 184 184
Consulting and legal fees 73 165 120
Amortization/impairment of intangible assets/goodwill 23 46 43
Other real estate expense 4140 264
Net loss/(gain) on debt extinguishment —16 (3)
Other noninterest expense 521 689 611
Total noninterest expense 5,880 6,323 6,234
Income before provision for income taxes 1,634 2,757 739
Provision for income taxes 273 773 79
Net income including income attributable to noncontrolling interest 1,361 1,984 660
Net income attributable to noncontrolling interest 17 26 13
Net income $1,344 $1,958 $647
Net income available to common shareholders $1,297 $1,931 $495
Net income per average common share:
Diluted $2.41 $3.59 $0.94
Basic 2.43 3.62 0.94
Dividends declared per common share 0.35 0.20 0.12
Average common shares - diluted 539,093 538,061 527,618
Average common shares - basic 534,283 534,149 523,995
1 Includes dividends on Coke common stock of $31 million and $56 million for the years ended December 31, 2012 and 2011, respectively.
2 Total OTTI was $0, $1 million, and $2 million for the years ended December 31, 2013, 2012, and 2011, respectively. Of total OTTI, losses of $1 million, $7 million, and $6 million
were recognized in earnings, and gains of $1 million, $6 million, and $4 million were recognized as non-credit-related OTTI in OCI for the years ended December 31, 2013, 2012,
and 2011, respectively.
See Notes to Consolidated Financial Statements.